Takeaways and Highlights from Payments, Policy, & Capital Summit

Skilled Nursing News’ Payments, Policy, and Capital Summit brought together executives, policy professionals, and capital providers to share their thoughts on the skilled nursing industry.

Skilled Nursing News’ Payments, Policy, and Capital Summit brought together executives, policy professionals, and capital providers to share their thoughts on the recent past, present, and future of the skilled nursing industry. Highlights and key takeaways from the three-day virtual event are summarized here.

The summit included sessions on capital and one main topic of discussion was private equity and skilled nursing. In regard to investor interest in skilled nursing, private equity has been the bright spot in terms of buying skilled nursing properties even as the sector endured its most challenging year on record in 2020. One theme, however, has been the flight to quality as investors are interested in the best operators and properties in order to mitigate risk when allocating new capital. Private equity is still excited about the opportunity in the future as long-term care needs will remain given the fact that a very large population will be very sick with multiple illnesses and will not be able to afford private pay assisted living and unable to receive care in the home 24 hours a day.

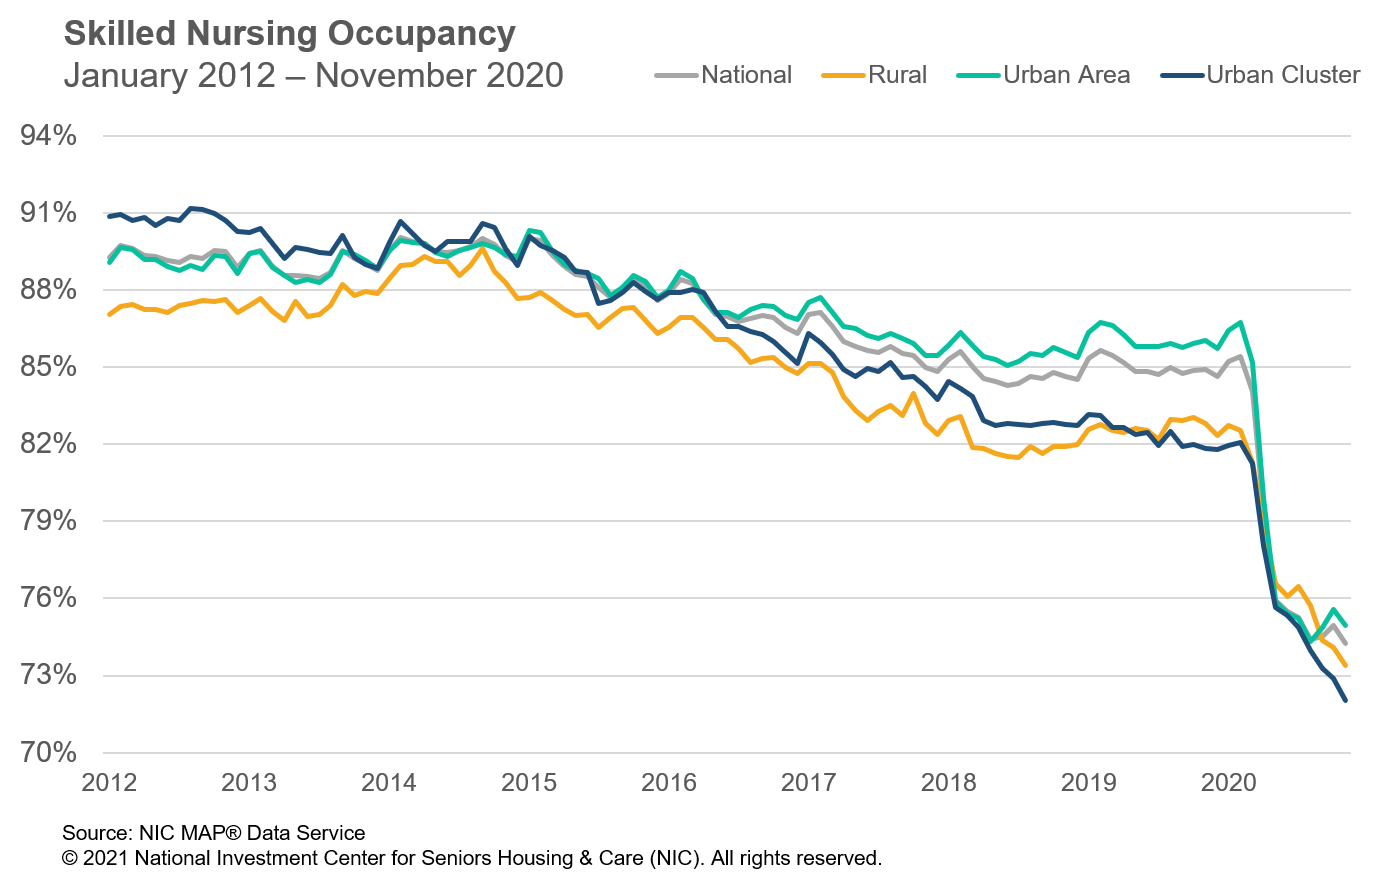
However, in the short-term private equity does have concerns given the challenges, hence the flight to quality operators and properties. Indeed, the difficulty in operations continues. Skilled nursing occupancy was at 74.2% as of November 2020 based on data from the recent NIC MAP Skilled Nursing Data Report, representing a 11.2 percentage point drop from February 2020.

Despite the operational challenges, some owner/operators and families with plentiful capital have been the main buyers throughout the pandemic. In fact, according to preliminary fourth quarter 2020 data from NIC/RCA private buyers closed on $4.2 billion worth of seniors housing and care transactions for the year of 2020, which represented 57% of the volume. In addition, and perhaps an example of the flight to quality, skilled nursing (nursing care in the graph below) property price per bed has held firm according to NIC/RCA price per bed data (see graph below for details and sources). This pricing trend below is a national rolling four-quarter measure and it is not same-store; the mix of properties could impact the results. However, it does reflect what is trading in the market albeit with relatively lower transactions closed in 2020 due to the pandemic.
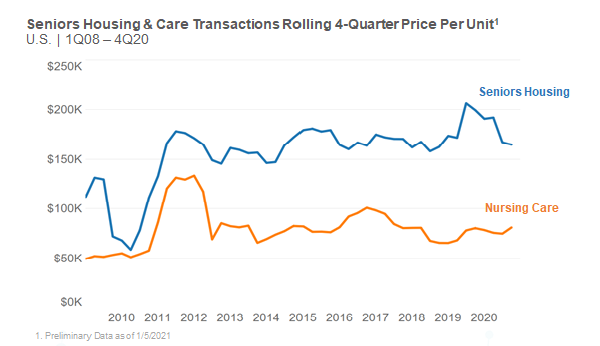
Seniors housing and care transactions price per unit

One of the comments made during the summit was that there were many transactions closed over $100,000 price per bed. So, what does this say as price per bed holds firm during this time of crisis? For one, the properties trading could be higher quality with good operators, as stated previously. In addition, there is still a very attractive expected spread in terms of the interest rates on debt and the expected long-term cash flow of a high-quality property, which may be supporting price levels.

Also, it was mentioned during the summit that government support has been a positive and private equity may be reassessing the “stroke-of-pen risk,” which is the risk that reimbursement rates are cut by the government. However, given the support of government funds during the pandemic investors may reassess the risk of government involvement as it has helped the sector stay afloat during this particular crisis. Lastly, there are some small private investors, owners and/or operators looking to expand regionally and have strong long-term views about the sector.

Much of the investor interest discussion, and the success of the sector, was certainly based on the quality operators but much of that quality is based on top talent and staff. It was mentioned that staff turnover was a top leading indicator of a successful operation before the pandemic and the belief is that is still the case. Staffing will continue to be a challenge now and after the pandemic and it should be a priority for both investors and operators alike to ensure the proper staffing is in place for all stakeholders.

As for what to expect on the policy and regulatory front, panelists covered labor and workforce topics such as the potential increase in minimum wage and mandatory staffing ratios, as well as what the future holds for PDPM, value-based purchasing, and risk-sharing models.

The Path to a $15 Minimum Wage

There are several states where a significant portion of the CNAs make less than $15 per hour – often starting at $9 or $10 per hour depending on market. With the new administration, there is certainly more discussion around a $15 minimum wage, which is a concern for many operators. As you might expect, states with the lowest CNA wages are the states that have really low Medicaid rates. As a result, providers simply do not have the resources to pay more than they are paying. Mark Parkinson, President & CEO, AHCA/NCAL emphasized that “if you do the minimum wage, you have to create a Medicaid mechanism that helps these states to pay for these wage increases.”

The upcoming stimulus bill will be passed with the reconciliation procedure, which requires only 51 votes. As a result of passing through reconciliation, there are only certain things that can be included in the bill, and currently, the prevailing view is that a minimum wage increase cannot legally be included. There is still a slim chance it’s ruled that the minimum wage increase can be included in the bill, but even if that is the case, it’s not clear that all Senate Democrats would vote for it. Additionally, the Biden proposal on minimum wage does increase the minimum wage to $15 per hour, but it is done with a gradual, phased approach, meaning the $15 wage would not be realized until 2025.

Other Regulatory Implications to Staffing

There’s good data available that indicates buildings with significant amounts of RN coverage, relative to buildings that didn’t, fared better with regards to COVID-19 cases and deaths. This may mean that there could be minimum staffing requirements established for the skilled nursing sector. Less likely, but still possible, could be including infection control experts within each of these sites as well. The caveat to successful implementation of these staffing minimums, however, is that these need to be funded under Medicaid for operators to be able to actually execute on these.

Enforcement – What Will be Scrutinized?

Given that nominated HHS Secretary Xavier Becerra is an Attorney General, it’s almost inevitable that oversight of skilled nursing will increase. One of the first things Seema Verma, former CMS Administrator, did was to issue a proposal that slowed down much of the requirements of participation that she felt had gone too far. The proposed rule was never finalized, and it is unlikely the Biden administration will finalize the rule.

There was a noticeable drop in civil monetary penalties (CMPs) under the Trump administration, but there may be pressure to get them back to where they were under the Obama administration. Right now, without an identified CMS Administrator and several important positions at CMS still open, there are a lot of unknowns, but that is likely to be on the table. The Biden administration is also going to take a close look at arbitration to see what can be done to decelerate its use.

There’s going to be a real push by the states to get rid of multi-resident rooms, specifically those that house 3 or 4 residents in a single room. This was brought to light as particularly problematic during the pandemic and private rooms are not only important for infection control, but also for quality of life and resident satisfaction as well.

Patient Driven Payment Model

The Patient Driven Payment Model – PDPM – has been one of the bright spots for the skilled nursing sector over the last year and a half. Despite concerns that the new payment system was not budget neutral, there were no substantive changes made to PDPM in 2020. This was in large part due to the COVID-19 pandemic overshadowing the concerns that some may have had about PDPM, and that may wind up being the case for 2021 as well. At some point the dust is going to settle and CMS will look again at the budget neutrality of PDPM.

There are some reasonable arguments to be made that could protect the gains that were realized under PDPM. First and foremost is that, as a whole, Medicare spending was down in 2020. Taking a step back and looking at the overall system puts PDPM in a better light.

Value-Based Purchasing

With the COVID-19 pandemic taking the full focus of the skilled nursing sector in 2020 and continuing into 2021, discussions about value-based purchasing and unified payments systems were not as prominent as they had been in the past. Once the pandemic is finally behind us, however, these conversations will once again become a more pressing topic.

As Scott Pilgrim, CEO, Diakonos Group points out, skilled nursing operators can secure additional Medicaid dollars, but must promise increased quality in return. Pilgrim notes that there are four mechanisms to increasing reimbursement rates under Medicaid and that policymakers see value in tying value-based purchasing to each of these four levers: base-rate increases, add-on rates, provider tax implementation, and inter-governmental transfer programs.

Risk-Sharing Arrangements – Medicare Advantage & Special Needs Plans

Medicare Advantage continues to grow, and that will continue to be the case. Market share for Medicare Advantage is approximately 35% and increasing each year by another 1%. I-SNPs provide an incredible incentive for operators to keep residents healthy. The COVID-19 situation was an incredibly difficult situation to navigate for I-SNPs, especially to those in the northeast. They were responsible for the entire risk of these residents, and in some cases were responsible for massive hospitalization bills. In other parts of the country, even with COVID, I-SNPs had done reasonably, as other medical expenses were down so much. All that being said, it’s clear that when the pandemic is finally behind us, risk-sharing type of arrangements are going to be an absolute must for providers that want to thrive.

Listening to all the potential policy and regulatory changes on the horizon made it clear: calls to reform post-acute and long-term care following the COVID-19 public health emergency, along with a new Presidential administration, mean the climate is ripe for potential regulatory changes to be implemented.
Skilled Nursing Occupancy Reached New Low In November 2020

NIC MAP® Data Service released its latest Skilled Nursing Monthly Report on February 4, 2021, which includes key monthly data points from January 2012 through November 2020.

Medicaid Revenue Per Patient Day Up But Cost of Care Still a Concern.

NIC MAP® Data Service released its latest Skilled Nursing Monthly Report on February 4, 2021, which includes key monthly data points from January 2012 through November 2020.

Here are some key takeaways from the report:

Occupancy

Occupancy continues to be challenged for skilled nursing properties, with the November 2020 occupancy rate falling to a new low of 74.2%. It was down 69 basis points from October (74.9%) and 11.2 percentage points from pre-pandemic levels in February 2020 (85.4%) and 10.7 percentage points from year-earlier levels. Since February 2020, COVID-19 has significantly impacted skilled nursing operations across the country due to high acuity levels of residents, pandemic-related deaths as well as fewer elective surgeries at hospitals which have resulted in less need for rehab services often provided by nursing care properties. As the country and the skilled nursing sector navigate through the Winter months and vaccine distributions, it is likely that occupancy will continue to face pressure.

skillednursing-chart1

Medicare

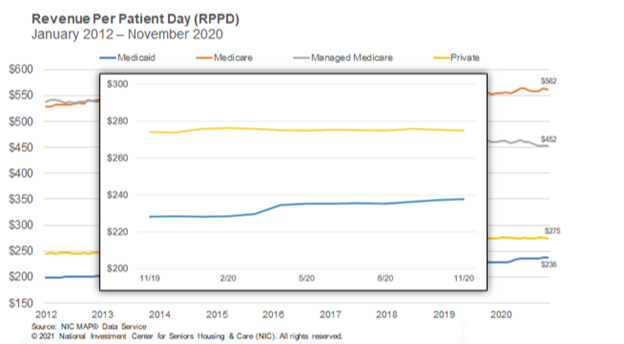
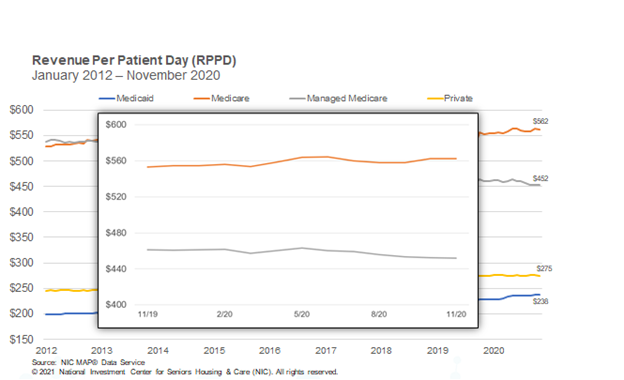
Medicare revenue per patient day (RPPD) was unchanged at $562 from October to November 2020. However, it is up by 1.6% since March. This increase is likely because of additional reimbursement by Medicare for COVID-19 positive patients requiring isolation, in addition to the temporary suspension of the 2.0% sequestration cuts by the Centers for Medicare and Medicaid Services (CMS). In addition, Medicare RPPD increased 1.7% compared to a year ago. Meanwhile, Medicare revenue mix increased 80 basis points from October to end November at 22.2%. It has increased 141 basis points since April.

skillednursing-chart2


Managed Medicare

Managed Medicare RPPD hit a time-series low (since 2012) as it decreased once again from the prior month. It ended November 2020 at $452. Early in the pandemic managed Medicare RPPD increased but has resumed the years-long trend of monthly declines. It is down 2.0% since November 2019 and has declined 16% ($86) since January 2012, Meanwhile, managed Medicare revenue mix decreased 36 basis points from October to November to 8.8%. However, it has declined 208 basis points since February, when it was 10.9% before the pandemic started.

Medicaid

The relatively large increases in Medicaid RPPD seen at the onset of the pandemic have slowed, especially after the 2.1% increase experienced in April. Early in the pandemic, initial increases in reimbursement from some states helped skilled nursing properties related to the number of COVD-19 cases at properties. In November, RPPD increased 0.2% from October, ending at $238. On a slightly longer time frame, Medicaid RPPD is up 4.2% from the prior year. However, even with this increase, the concern continues to be that current Medicaid RPPD does not cover the actual cost of care in most states.

skillednursing-chart3-1


To get more trends from the latest data you can download the Skilled Nursing Monthly Report here. There is no charge for this report.

The report provides aggregate data at the national level from a sampling of skilled nursing operators with multiple properties in the United States. NIC continues to grow its database of participating operators in order to provide data at localized levels in the future. Operators who are interested in participating can complete a participation form here. NIC maintains strict confidentiality of all data it receives.

4Q 2020 CCRC Care Segment Performance Leads Non-CCRCs

Tracking occupancy, asking rents, demand, inventory, and construction data for independent living, assisted living, memory care, nursing care, and continuing care retirement communities (CCRCs), also referred to as life plan communities.

As the leading data provider for the seniors housing and care sector, the NIC MAP® Data Service (NIC MAP) tracks occupancy, asking rents, demand, inventory, and construction data for independent living, assisted living, memory care, nursing care, and continuing care retirement communities (CCRCs), also referred to as life plan communities. This data is collected for more than 15,000 properties across 140 metropolitan areas. NIC MAP currently tracks 1,208 not-for-profit and for-profit entrance fee and rental CCRCs in these 140 combined markets (1,137 in the 99 combined Primary and Secondary Markets).

The following analysis examines current conditions and year-over-year changes in inventory, occupancy, and same store asking rent growth—by care segments within CCRCs (CCRC segments) compared to non-CCRC segments in freestanding or combined communities to focus a lens on the relative performance of care segments within CCRCs.

Current CCRC Occupancy by Payment Type and Profit Status

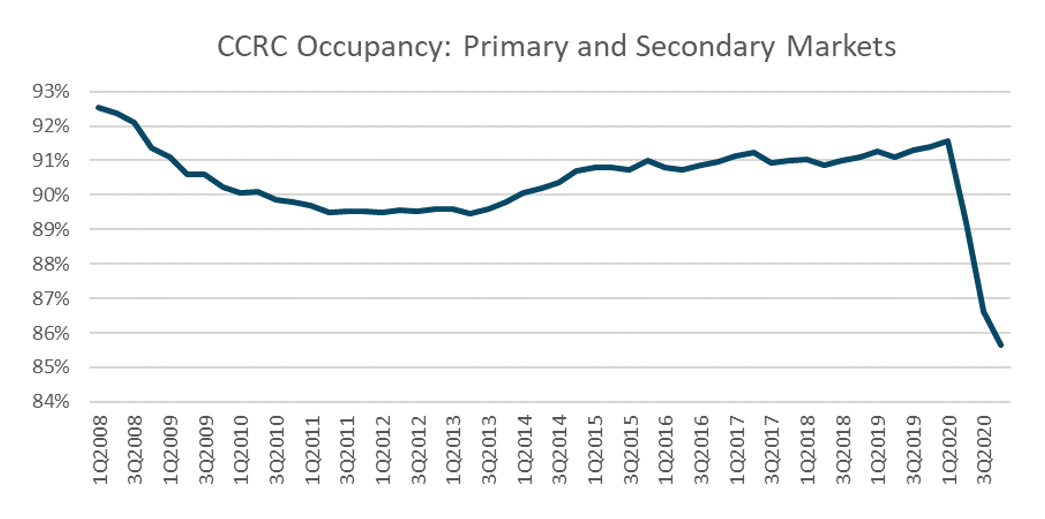
In the fourth quarter of 2020, CCRC occupancy fell 90 basis points from the third quarter to 85.7%, its lowest level since NIC MAP began reporting the data in 2006. The cumulative drop in occupancy was 350 basis points since the pandemic began to have an impact on occupancy rates. Prior to 2Q 2020, CCRC occupancy oscillated around 91% for 22 consecutive quarters.

ccrcchart1 

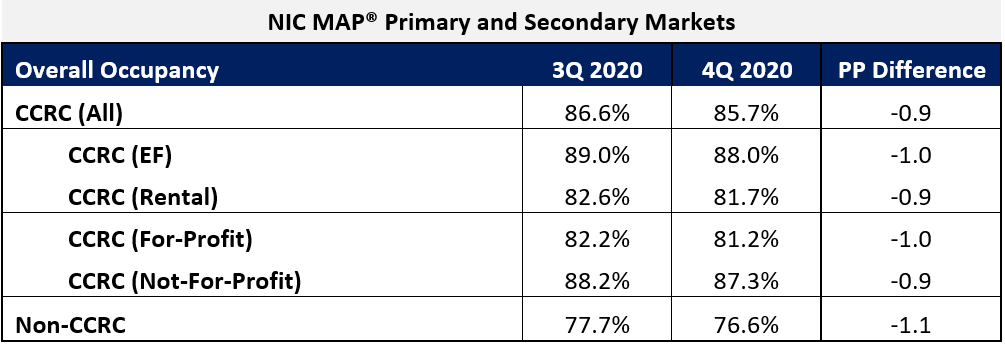
Non-CCRC occupancy averaged 76.6% in 4Q 2020—a very wide 9.1 percentage points lower than CCRC occupancy (85.7%). Entrance fee CCRC occupancy was 6.3 percentage points higher (88.0%) than rental CCRCs (81.7%), and not-for-profit CCRC occupancy was 6.1 percentage points higher (87.3%) than for-profit CCRCs (81.2%).

ccrcchart2


CCRCs vs. Non-CCRCs: Care Segment Detail

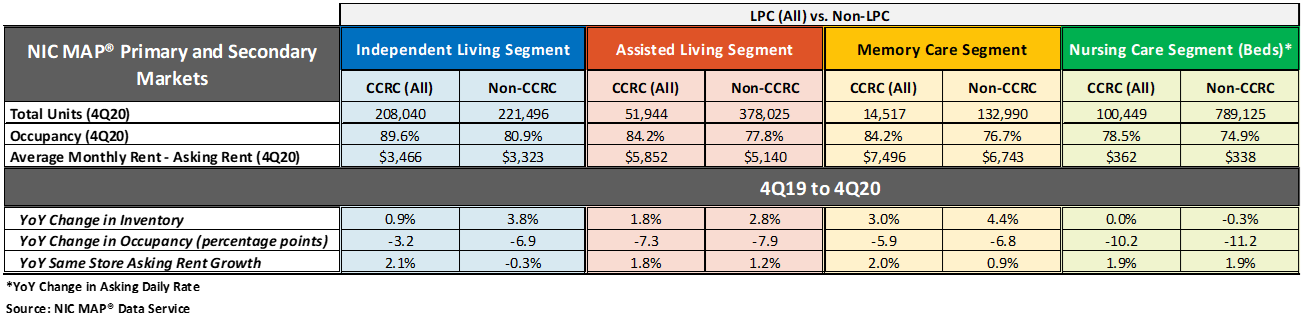
The table below compares each of the care segments—independent living, assisted living, memory care, and nursing care—in the Primary and Secondary Markets. The table shows the 4Q 2020 total open units, occupancy and average monthly asking rent—and year-over-year changes for CCRCs and non-CCRCs.

The CCRC independent living care segment (which represents 55.5% of CCRC units) garnered the highest occupancy in the fourth quarter of 2020 (89.6%), as well as the least year-over-year drop in occupancy falling 3.2 percentage points. The current nursing care segment occupancy rate in non-CCRCs, which represents 51.9% of non-CCRC units, was much lower at 74.9%, and fell 11.2 percentage points year-over-year.

 ccrcchart3


Higher occupancy at CCRCs

The CCRC independent living care segment had the highest 4Q 2020 occupancy (89.6%), followed by CCRC assisted living and memory care (84.2%, respectively), and CCRC nursing care (78.5%). Among non-CCRCs, the independent living care segment had the highest 4Q 2020 occupancy (80.9%), followed non-CCRC assisted living (77.8%), memory care (76.7%) and nursing care (74.9%).

The difference in 4Q 2020 occupancy between CCRCs and non-CCRCs was the highest for the independent living segment (8.7 percentage points), followed by the memory care segment (7.5 percentage points), the assisted living care segment (6.5 percentage points), and the nursing care segment (3.6 percentage points).

Occupancy declined from year-earlier levels for each of the care segments. However, CCRCs had lesser declines in occupancy than non-CCRCs. Among CCRCs, independent living care segment occupancy declined the least (-3.2 percentage points), followed by memory care (-5.9 percentage points), assisted living (-7.3 percentage points), and the nursing care segment (-10.2 percentage points). Among non-CCRCs, memory care and independent living segment occupancy declined the least (-6.8 and -6.9 percentage points, respectively), followed by assisted living (-7.9 percentage points), and the nursing care segment (-11.2 percentage points).

Higher annual, same store asking rent growth at CCRCs

Overall, CCRC same store year-over-year asking rent growth in the fourth quarter of 2020 was 2.4%, down from the time series high of 4.7% reached in the first quarter of 2019, but slightly higher than the time series low of 2.1% at the end of 2010, the end of 2013 and beginning of 2014. Year-over-year asking rent growth did not vary significantly across the CCRC care segments unlike the non-CCRC care segments; the variation was only 30 basis points for CCRCs but 220 basis points for non-CCRCs. Among CCRCs, the highest year-over-year asking rent growth was 2.1% in the independent living segment; among non-CCRCs it was highest in the nursing care segment (1.9%). The lowest year-over-year asking rent growth was noted for CCRCs in the assisted living care segment (1.8%); in non-CCRCs it was noted for the independent living care segment (-0.3%).

Significantly weaker inventory growth at CCRCs

Non-CCRCs had higher rates of inventory growth (year-over-year change in inventory) by segment than CCRCs, with the exception of the nursing care segment. The highest rates of inventory growth were reported for non-CCRCs in the memory care and independent living care segments (4.4% and 3.8%); the lowest were reported for both CCRCs and non-CCRCs in the nursing care segment (0.0% and -0.3%, respectively). Negative inventory growth can occur when units/beds that are temporarily or permanently taken offline, or converted to another care segment, outweigh added inventory.

Occupancy rates vary by region and payment type

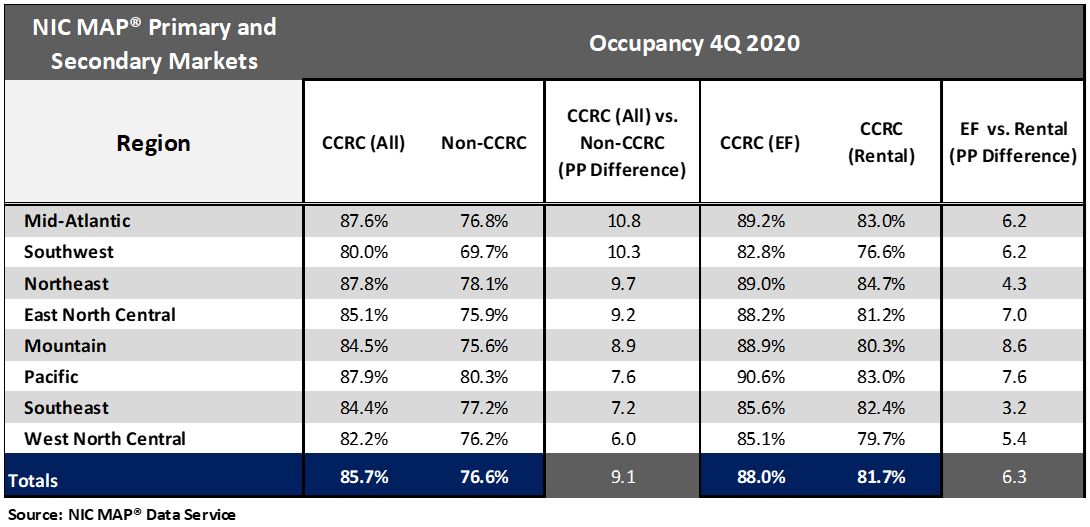
Seniors housing and care communities in the Pacific, Northeast, and Mid-Atlantic regions, which were more significantly impacted earlier in the pandemic than other regions, currently have the strongest CCRC occupancy rates ranging from 87.9% to 87.6%. The weakest CCRC and non-CCRC occupancy is in the Southwest region at 80.0% and 69.7%, respectively. That said, the greatest difference in CCRC and non-CCRC occupancy was in the Mid-Atlantic region—a 10.8 percentage point difference.

The difference in fourth quarter occupancy rates between entrance fee and rental CCRCs was the greatest in the Mountain region (8.6 percentage points), followed by the Pacific (7.6 percentage points), and the East North Central region (7.0 percentage points).

ccrcchart4

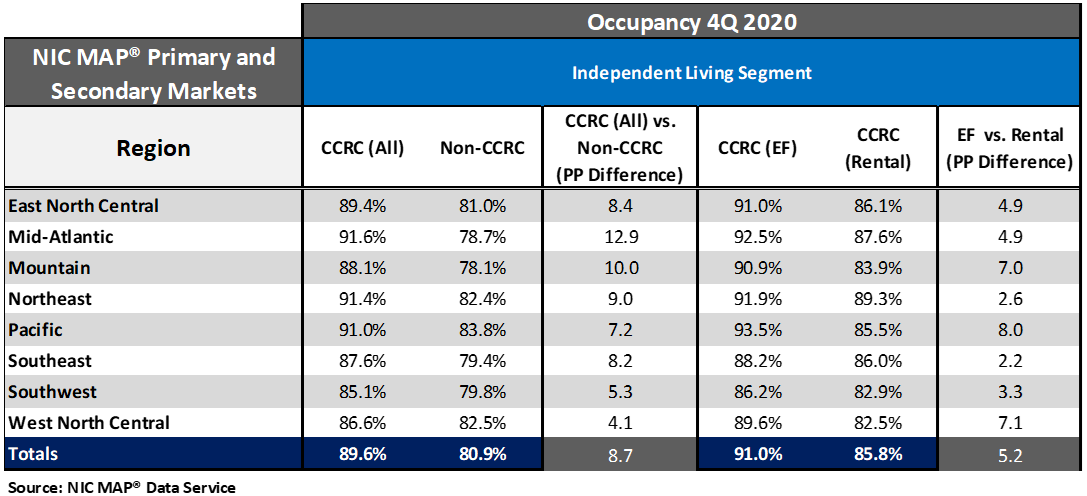
Looking specifically at the independent living care segment by payment type, the difference in fourth quarter occupancy rates between entrance fee and rental CCRCs was the greatest in the Pacific region (8.0 percentage points), followed by the West North Central region (7.1percentage points), and the Mountain region (7.0 percentage points).

ccrcchart5

Look for future blog posts from NIC to delve deep into the performance of CCRCs.

To learn more about NIC MAP® Data Service, and the latest metro-level data they can provide to support your organization through their various product offerings, schedule a meeting with a product expert today.

{{cta(‘bcaafbdc-4095-4a32-bab0-45f0ce50ac2e’)}}

Middle-Market Model Requires Creative Approaches

Alternative housing models for middle-income seniors were explored at the 2020 NIC Fall Conference in a session titled Senior Housing’s New Reality: Impacts and Ideas for the Forgotten Middle.

The senior living market faces a new reality. The economic fallout of the pandemic has put pressure on the affordability of many communities. Elders who previously had the resources to move into a community may no longer be able to do so, expanding the already large group of seniors with modest incomes in need of housing. At the same time, more middle-income seniors are drifting into the low-cost end of the market.

Alternative housing models for middle-income seniors were explored at the 2020 NIC Fall Conference. The session, “Senior Housing’s New Reality: Impacts and Ideas for the Forgotten Middle,” was led by Torey Riso, an investor and independent consultant. He was joined by John Cochrane, CEO, HumanGood; James Lydiard, staff vice president, CareMore Health; and Bill Pettit, president, R.D. Merrill Company.

Riso kicked off the discussion noting that a NIC-funded study in 2019 highlighted the need for middle-market housing. The study showed that 54% of seniors could not afford much of the seniors housing product on the market. “The pandemic focused attention on the already challenging reality to serve this middle market,” said Riso. He added that there is an opportunity to change the rules and reconsider all elements of the seniors housing model: the building, financing, services, staffing and payment sources.

The panelists discussed three different approaches to help reduce the cost of housing for middle-income seniors.

Create a Mixed-Use Community

HumanGood operates life plan communities and affordable housing for low-income seniors. The challenge is to meet the needs of the 80% of seniors who fall between those two extremes, noted Cochrane. “We have a unique opportunity to bridge the gap.”

Cochrane pointed to the successful example of Plaza Roberto Maestas, a transit-oriented community in Seattle’s Beacon Hill neighborhood, financed with public and private funding sources. The development is more than housing, creating a true community. Elements include affordable apartments for seniors and families, along with retail and commercial space, an early childhood facility and a community center. The project is situated around a central plaza, allowing all age groups to interact. “The project connects to the larger community,” said Cochrane.

Middle market communities will increasingly rely on complex financing structures, such as those used at Plaza Roberto. “That is the future,” said Cochrane. “No one size fits all.” He added that the size and stability of the affordable seniors housing market will attract investors that will enjoy reliable returns over a long period as well as a social benefit.

Rethink the Full-Service Model

Owner /operator Merrill Gardens primarily serves seniors in the upper 25% income category. But management felt the company was losing touch with its traditional middle-income base. So, Merrill Gardens partnered with ReNew REIT and purchased a portfolio of older seniors housing properties. The cost of the properties was lower than that of new developments which could help lower rents for residents.

The properties will be rolled out as a new brand for middle-income seniors. But despite the lower cost basis of the properties, Pettit noted that much of the rent is still driven by operations. “We need to think about how to deliver a valuable product for middle-income seniors,” he said.

The new brand will not be a full-service model. Instead, it will be designed around what typical seniors might do for themselves living at home. “We think middle-income seniors are more open to participating in their own needs,” said Pettit. For example, instead of a restaurant-style dining program with multiple menu items, the new model might offer food options more like those available at an extended stay hotel. The new model also will take a close look at alternative service delivery models to cut personnel expenses. “Take off your full-service hat,” Pettit advised.

Merrill is exploring partnerships with local providers, such as home health services. The family will also be a key partner to provide some care needs.

Pettit believes that through partnerships on the care side, and dining changes, that the buildings can operate at rents of $1,000 to $2,000 less a month than at higher-end properties. That provides a lower profit margin than that of the expensive projects. But when the real estate is acquired at a 40-45% discount to new development, the yield on cost is superior, according to Pettit.

Reduce Healthcare Costs

The pandemic has shown that housing and healthcare are intrinsically linked. Making healthcare accessible and affordable helps reduce care costs and increase the residents’ length of stay. CareMore offers a Medicare Advantage plan for seniors housing properties that can help offset care costs. When enough residents sign up for the plan, CareMore can provide medical personnel on-site. Also, working with one health plan can save the community staff time spent coordinating care among different providers. “Government funded dollars should be part of the equation,” said Lydiard. He added that the Medicare program is seeking novel approaches to reduce costs. Seniors housing, where care can be delivered efficiently to a growing number of elders, will be part of the solution.


The panelists agreed that more than one solution will emerge to meet the challenge to house middle and lower-income seniors. “This is a huge market, and its needs are varied,” said Cochrane. “There will be different models and we will need every one of them.”


U.S. Jobs Fall in December for First Time Since April

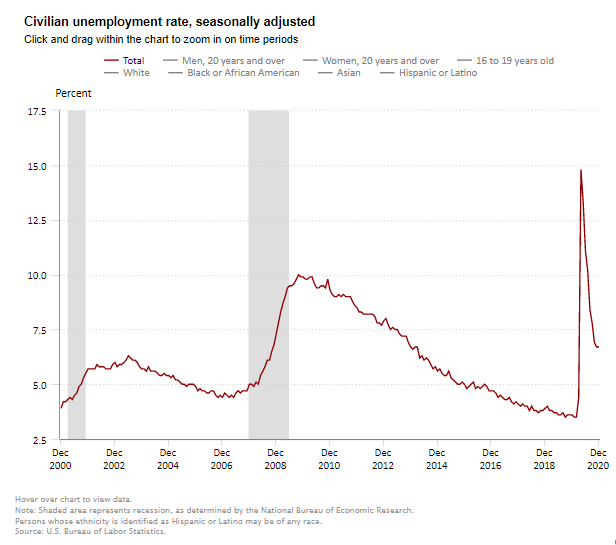
The Labor Department reported that nonfarm payrolls fell by 140,000 in December and that the unemployment rate was unchanged at 6.7%. This was the first decline in jobs since April and reflects the recent increase in COVID-19 cases and efforts to contain the pandemic.

The Labor Department reported that nonfarm payrolls fell by 140,000 in December and that the unemployment rate was unchanged at 6.7%. This was the first decline in jobs since April and reflects the recent increase in COVID-19 cases and efforts to contain the pandemic.
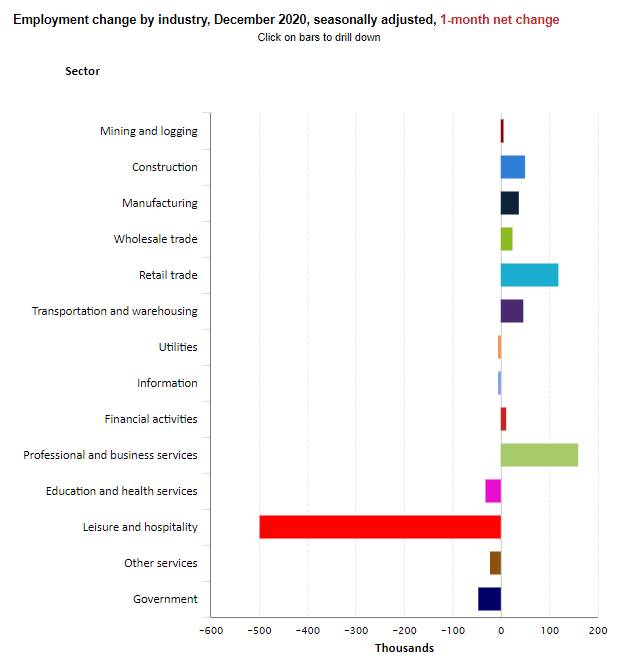
Job losses were concentrated in leisure and hospitality sectors (down 498,000 jobs) as bars and restaurants have been shut down due to the surge in coronavirus infections. Professional and business services, retail trade and construction saw gains. The consensus estimates for December had been for a gain of 50,000. Through December, 9.8 million jobs have been lost since February.
 

Health care added 39,000 jobs in December, with the largest gains occurring in hospitals and ambulatory health care services. Nursing care facilities lost 6,000 jobs in December, while jobs in community care facilities for the elderly lost 5,000 positions. Health care employed 502,000 fewer workers in December than in February.

The December unemployment rate was unchanged from November after having fallen for seven consecutive months.   It remains 3.2 percentage points above the pre-pandemic level of 3.5% seen in February, but well below the 14.7% peak seen in April.  

The number of long-term unemployed (those jobless for 27 weeks or more) was little changed from November at 4.0 million, but has increased by 2.8 million since February, suggesting that this continues to be a very challenging time for many Americans. Long-term unemployed persons account for 37.1% of the total number of unemployed persons.  

The underemployment rate or the U-6 jobless rate fell to 11.7% in December from 12.0% in November. This figure includes those who have quit looking for a job because they are discouraged about their prospects and people working part-time but desiring a full work week.  

Average hourly earnings for all employees on private nonfarm payrolls rose by $0.23 in December to $29.81, a gain of 5.1% from a year earlier. These increases largely reflect the disproportionate number of lower paid workers in leisure and hospitality who went off payrolls, which put upward pressure on the average hourly earnings estimates. 

The labor force participation rate, which is a measure of the share of working age people who are employed or looking for work was steady 61.5% in December.

The change in total nonfarm payroll employment for October was revised up by 44,000 from 610,000 to 654,000 and the change for November was revised up by 91,000 from 245,000 to 336,000. Combined, 135,000 jobs were added to the original estimates.   Monthly revisions result from additional reports received from businesses and government agencies since the last published estimates and from the recalculation of seasonal factors.  

The decline in jobs reflects the large number of newly diagnosed COVID-19 infections and its impact on business closures. Many states are re-imposing lockdowns. Widespread distribution of vaccines is needed to allow for a more complete re-opening of the economy and a recovery in jobs. Congress needs to act to implement further fiscal stimulus to support a recovery. Without a fiscal stimulus package, the economy is likely to sputter until a vaccine can be safely and widely distributed.