
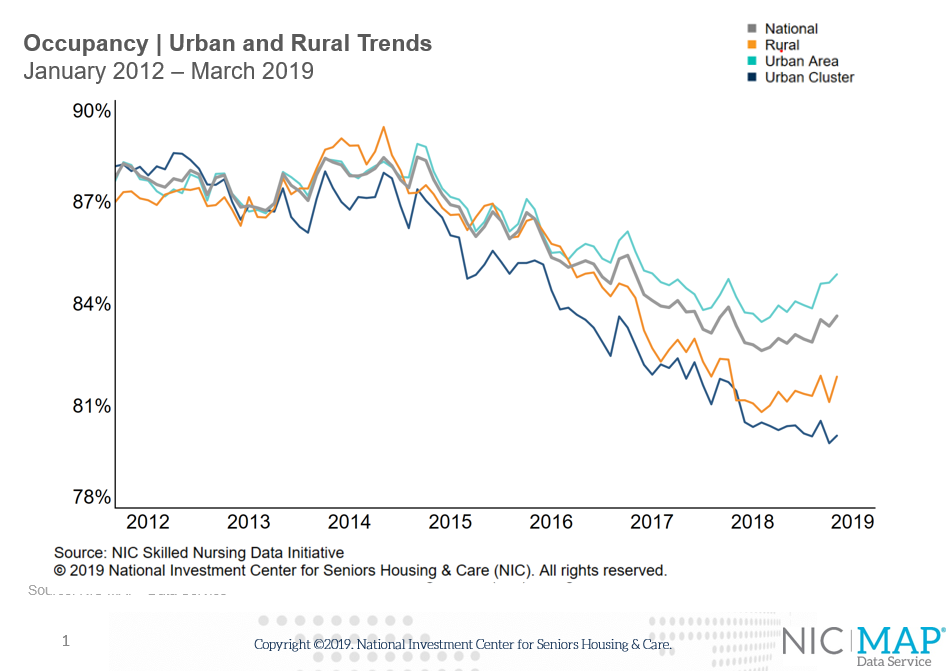
- First year-over-year occupancy increase since January 2015
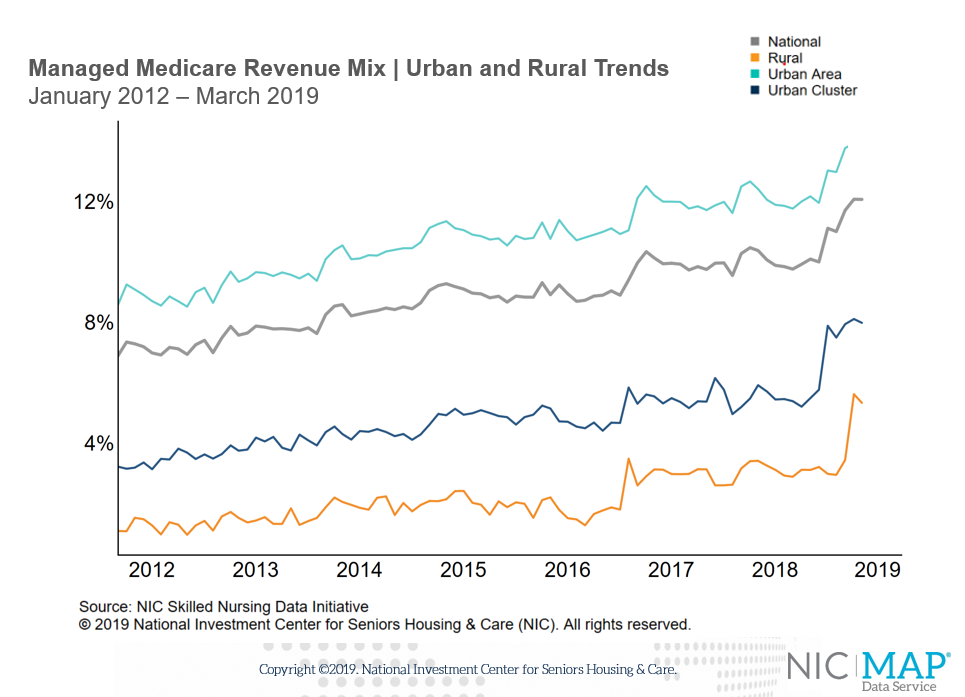
- Managed Medicare revenue mix reaches time-series high of 12.1%, higher in urban areas
NIC released its first quarter 2019 Skilled Nursing Data Report last week, which includes key monthly data points from January 2012 through March 2019.
Here are some key takeaways from the report:
- Occupancy has been on an upward trend since June of last year (2018). Overall occupancy increased 77 basis points from the fourth quarter of 2018 to 83.7% in the first quarter of 2019, the highest rate since the first quarter of 2018. An increase in occupancy is typically expected from the fourth to the first quarter, given the flu season and higher admissions in the winter months. However, as occupancy has shown strength over the past several months, it suggests that seasonality is not the only factor in the recent uptrend in occupancy. In fact, year-over-year occupancy was also positive as it increased 28 basis points from March of 2018. This is the first yearly increase in occupancy since January 2015. The occupancy trend was the same in both rural and urban areas as it increased on both a quarterly and yearly basis. The quarterly occupancy increase was more pronounced in urban areas, however, as it increased 100 basis points from the fourth quarter to 84.9% at the end the first quarter 2019.

- First quarter skilled mix increased from the fourth quarter. The gain was mostly driven by the increase in managed Medicare, although Medicare mix rose as well. This suggests that higher acuity patients were a driver in the first quarter as they are often admitted during the winter/flu season which in turn often drives an increase in overall occupancy. Skilled mix increased 84 basis points from the fourth quarter 2018 to end the first quarter 2019 at 26.0%. However, skilled mix was down 103 basis points compared to the first quarter of 2018 when it was at 27.0%. Skilled mix increased in urban and rural areas as well compared to the fourth quarter 2018 ending at 27.0% and 22.2%, respectively. Urban and rural both declined in terms of skilled mix compared to March 2018.
- Overall managed Medicare revenue mix reached a time-series high in the first quarter 2019, ending March 2019 at 12.1%. This revenue mix increased 106 basis points from the fourth quarter of 2018 and 169 basis points from the first quarter of 2018 when it was 10.4%. This continued growing influence on operator revenue further demonstrates the importance of the managed Medicare payor within the skilled nursing sector. This trend is evident across both the urban and rural areas. The revenue mix is highest in the urban areas, where penetration is higher due to the density and managed care opportunity, as it ended the first quarter 2019 at 14.0%. Interestingly, the rural areas now register over 5% in terms of managed Medicare revenue mix ending the first quarter 2019 at 5.4%.

- Managed Medicare revenue per patient day (RPPD) pressures became evident again in the latest data as it decreased from $439 in the fourth quarter 2018 to $432 as of March 2019. It was down $14, or 3.2%, compared to a year ago when the RPPD was $446. This trend is evident in both urban and rural areas as the RPPD decreased on a quarterly basis and yearly basis in both geographies. It ended the first quarter 2019 at $436 in urban areas and $408 in rural areas. The RPPD decrease in the rural areas likely has less of an impact on the business as the managed Medicare penetration is smaller than in urban areas. The managed Medicare patient day mix in rural areas is only 3.4% compared to the 8.6% in urban areas.
- Medicaid patient day mix decreased to 65.8% in the first quarter 2019 compared to the 66.4% in the fourth quarter 2018. The decrease in patient day mix is likely due to the increase in other payer sources, e.g. Medicare and managed Medicare, rather than a decrease in patient admissions, as occupancy increased overall in the first quarter 2019. The decrease in Medicaid patient day mix from the fourth quarter 2018 to the first quarter 2019 was driven by the urban areas as it decreased 80 basis points to 66.5%. Rural area Medicaid patient day mix increased 22 basis points to 61.9%.
To get more trends from the latest data you can download the NIC Skilled Nursing Data Report by clicking the button below. There is no charge for this report.

The report provides aggregate data at the national level from a sampling of skilled nursing operators with multiple properties in the United States. NIC continues to grow its database of participating operators in order to provide data at localized levels in the future. Operators who are interested in participating can complete a participation form at http://www.nic.org/skillednursing. NIC maintains strict confidentiality of all data it receives.