NIC MAP® Seniors Housing Rate Tiers
Similar to the intent of “class categorizations” seen across other commercial real estate property types, NIC MAP® has recently developed a “rate tiers” approach to our seniors housing property database that is quantitative and objective, with a goal to further segment our data for our clients. Useful to investors, analysts and senior living operators who wish to benchmark their properties to properties with similar rate structures, this approach allows NIC to promote greater transparency within the seniors housing property type and creates greater comparability to other commercial real estate property types.
- The NIC MAP Seniors Housing Rate Tiers Report provides a historical time series of average market rates (AMRs) and AMR annual rate growth, occupancy and inventory for majority independent living (IL) or majority assisted living (AL) property types by rate tier and metropolitan market for the 31 Primary Markets.
- Additionally, the report includes market aggregates for the 31 Primary Markets, Secondary Markets (32-99), and the 99 Primary and Secondary Markets.
- Defined uniquely for each metropolitan market (as opposed to a national average), three rate tiers for each metropolitan area have been estimated based on average market rate (AMR) data that is segmented by quartiles into three groupings: top tier (i.e., top quartile), middle tier (i.e., middle two quartiles), and bottom tier (i.e., bottom quartile). Each quarter, a property is classified into one of these three categories, and the designation of a property can change from one quarter to the next.
- The NIC MAP Seniors Housing Rate Tiers Report has a “same-store” methodology for computing rate growth within each tier. Year-over-year rate growth is computed by using only the properties included within a respective rate tier from one period to the next.
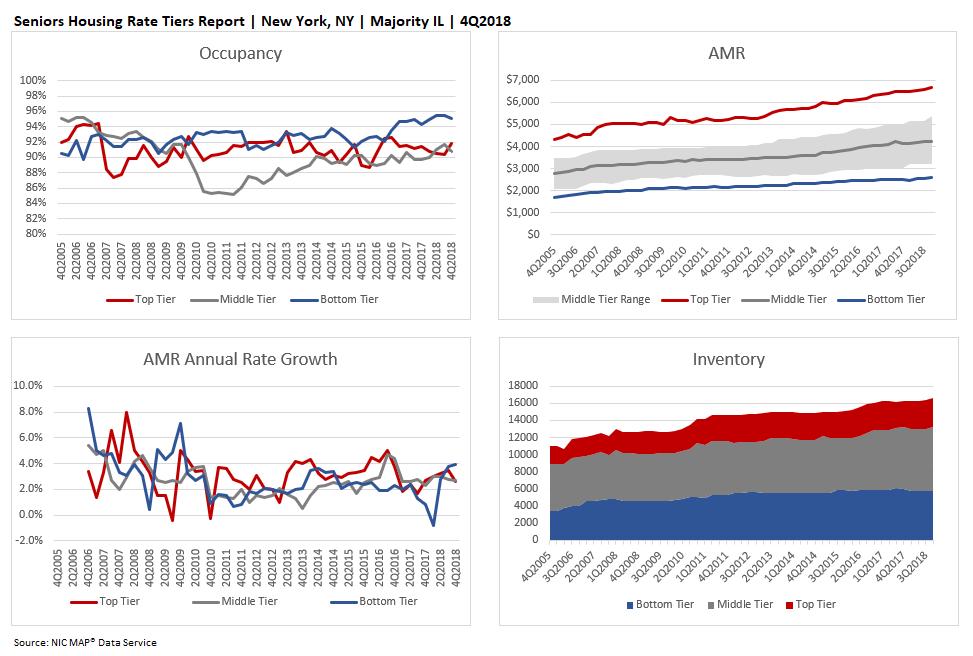
The example below shows the standard four charts found in this report for the New York metropolitan market from 4Q2018.
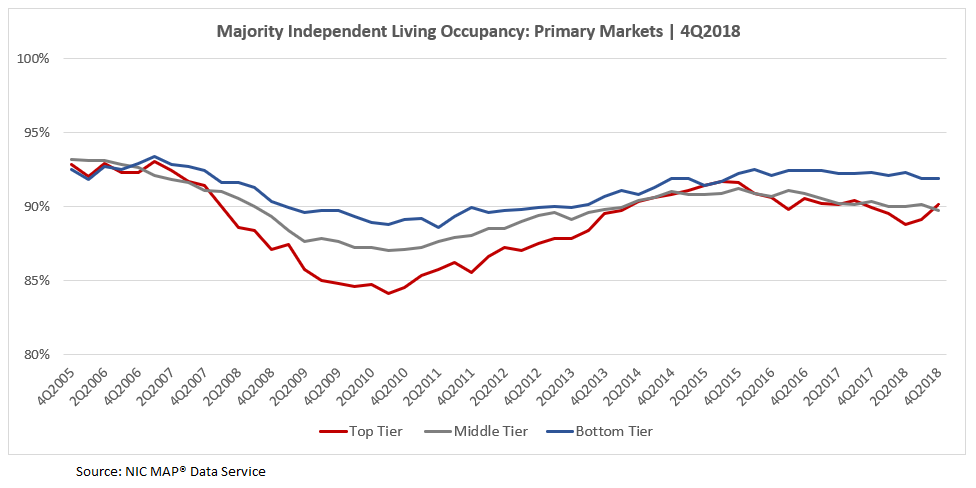
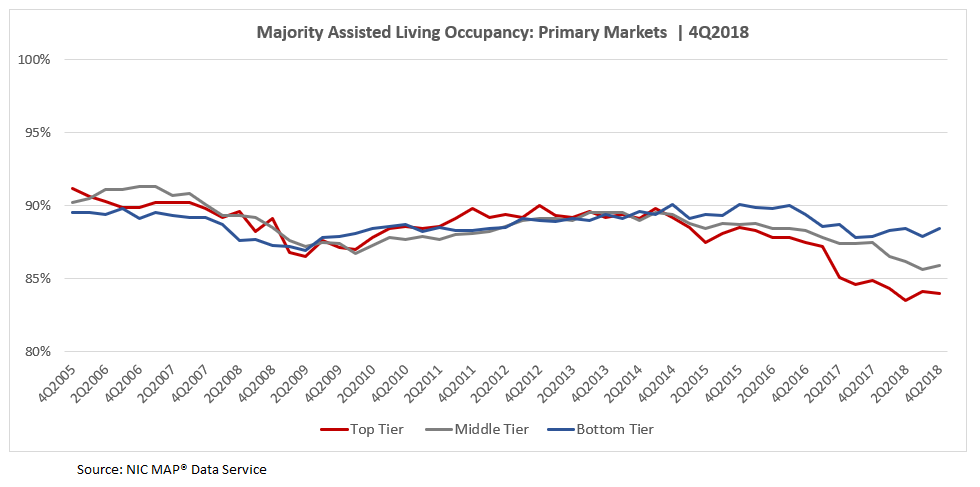
The following charts display occupancy by NIC’s three rate tiers for majority independent living and majority assisted living across the time series, aggregated for the 31 Primary Markets.
The data tells an interesting story in that independent living and assisting living occupancy results by rate tier have followed different patterns. The occupancy rate for bottom tier majority independent living properties in the 31 Primary Markets has generally outpaced the top and middle tiers since 3Q2006. The occupancy “spread” by rate tier was the greatest during and coming out of the Great Recession, perhaps due to the greater affordability of bottom tier properties, which may have allowed them to maintain higher occupancy rates than the top and middle rate tiers. More recently, majority independent living occupancy rates for the three rate tiers converged and reached a near-term peak close to 91% in the second and third quarters of 2015. Since then, and as the market has softened, the difference in occupancy rates between the bottom and top tiers widened to as much as 3.5 percentage points in 2Q2018, when the average occupancy rate of majority independent living properties in the 31 Primary Markets was at a 4-year low point. Currently, in 4Q2018, bottom tier majority independent living occupancy (91.9%) is 1.8 percentage points higher than in the top tier (90.1%).
However, rate tier occupancy for majority assisted living property types in the 31 Primary Markets followed a different pattern. Bottom tier majority assisted living property occupancy rates were lower than the top and middle tiers leading into and through most of the Great Recession. Coming out of the Great Recession, majority assisted living inventory grew at a faster pace than majority independent living, and occupancy across rate tiers was relatively narrow until it began to diverge around the fourth quarter of 2014, as strong supply growth outpaced demand. Since then, bottom tier occupancy rates have exceeded the top and middle tiers. In 4Q2018, majority assisted living occupancy in the 31 Primary Markets was 85.4%, near its record low rate of 85.3% reached in 2Q2018, when the difference between the bottom and top tiers was the widest at 4.9 percentage points. As of the fourth quarter, the difference between the bottom and top tiers is 4.4 percentage points.
In the coming months, NIC will begin to explore a number of intriguing questions raised by the data:
- Are markets with high top tier AMR annual growth rates dominated by large chain properties?
- Do markets with high variability between the top and bottom tiers suggest the need for greater local focus when analyzing the market fundamentals?
- What are the benefits and drawbacks of investing in metropolitan markets with wide or narrow variations in top and bottom tier pricing?
- Do top tier properties tend to be newer and bottom tier properties older?
- Are top tier properties located in neighborhoods with higher property values than bottom tier properties?
- Does the greater affordability of bottom tier properties help insulate them from occupancy pressures in times of fluctuating local demographic and economic conditions?
- How does AMR annual rate growth relate to changes in inventory and occupancy by rate tier?
The “rate tiers” approach to NIC’s seniors housing property database is, indeed, a “game changer.” This new report provides NIC MAP clients another way to segment the data with increased granularity, allows for greater comparability to other commercial real estate property types, and delivers on NIC’s mission to promote greater transparency within the seniors housing sector.