Executive Survey Insights | Wave 31: July 12 to August 8, 2021

NIC’s Executive Survey of operators in seniors housing and skilled nursing is designed to deliver transparency into market fundamentals in the seniors housing and care space as market conditions continue to change.

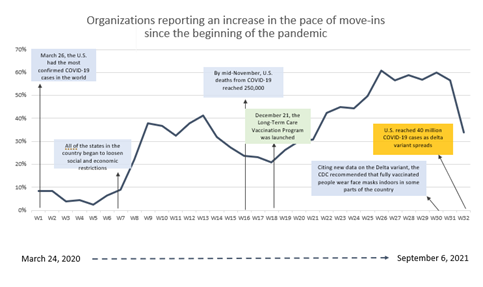
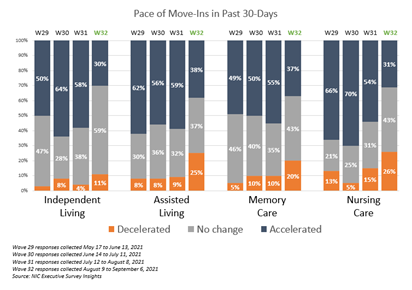
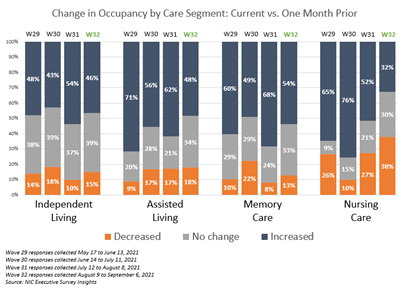
“Despite the rise in circulation of the Delta variant of the COVID-19 virus, resident demand remains the driving force behind acceleration in the pace of move-ins. Between roughly 55% and 60% of organizations report that the pace of move-ins accelerated in the past 30-days, and similar proportions report a corresponding increase in occupancy. Other reasons for relatively strong pace of move-ins include residents moving through the continuum of care and the success of redoubled marketing efforts. NOI is likely being squeezed as all respondents in the Wave 31 survey indicated their organizations were experiencing staffing shortages, and all are currently paying staff overtime hours (100%), up from a low of 76% in the Wave 13 survey conducted in early-October 2020.

–Lana Peck, Senior Principal, NIC

NIC’s Executive Survey of operators in seniors housing and skilled nursing is designed to deliver transparency into market fundamentals in the seniors housing and care space as market conditions continue to change. This Wave 31 survey includes responses collected July 12 to August 8, 2021, from owners and executives of 70 small, medium, and large seniors housing and skilled nursing operators from across the nation, representing hundreds of buildings and thousands of units across respondents’ portfolios of properties.

Detailed reports for each “wave” of the survey and a PDF of the report charts can be found on the NIC COVID-19 Resource Center webpage under Executive Survey Insights.

Wave 31 Summary of Insights and Findings

  • Between roughly 55% and 60% of respondents note that the pace of move-ins accelerated in the past 30-days. The shares of organizations reporting acceleration in the pace of move-ins varied slightly from recent surveys for independent living, assisted living and memory care segments. For nursing care, the shift was a bit larger, with fewer organizations reporting acceleration in the pace of move-ins in Wave 31 compared with Waves 29 and 30. For nursing care, around half (54%) saw the pace of move-ins accelerating in the past 30-days, down from 70% in Wave 30 and possibly reflecting the uptick in COVID-19 cases in areas of the country with low vaccination rates.     
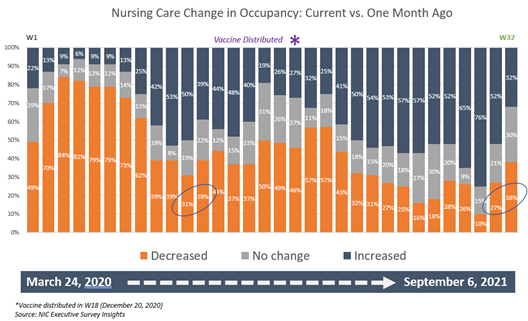
  • The chart below illustrates the full time series of Executive Survey Insights data collected since near the beginning of the pandemic in March 2020 to August 8, 2021, regarding the pace of move ins for the nursing care segment. Looking across 31 waves of survey responses one can see the improvement in the pace of move-ins (blue segments) after the vaccine was distributed in Wave 18 (late December) in sharp contrast to the significant deceleration in the pace of move-ins witnessed earlier in the pandemic (orange segments).

  • Increased resident demand has been cited by nine out of ten respondents as a reason for acceleration in move-ins since the Wave 25 survey conducted in the latter half of March. In the Wave 31 survey, the percent of respondents citing hospital placement declined from 42% in Wave 30 to 21%. This decrease may reflect concerns about the rise in circulation of the Delta variant of the COVID-19 virus in many areas of the country. Other reasons for a shift in move-in patterns include residents moving through the continuum of care and the success of redoubled marketing efforts.

  • Between roughly 50% and 70% of organizations report an increase in occupancy in Wave 31, with the memory care segment showing the most improvement since the prior survey (68%). The share of organizations that expect their occupancy to return to pre-pandemic levels has remained consistent since the question was first asked in the latter half of February. Since then, nearly two out of three respondents (61%) anticipate their organization’s occupancy will rebound to pre-pandemic levels sometime in 2022.

  • During the Wave 31 survey data collection period (July 22 to August 8), several senior living companies—including some of the nation’s largest operators—have mandated the COVID-19 vaccine for employees. Additionally, major trade organizations AHCA/NCAL and LeadingAge and 56 healthcare groups recently urged vaccination requirements for all healthcare and long-term care employers. The chart below reflects the growing share of respondent organizations that will likely require the vaccine for their employees. (The Wave 32 survey asks respondents to indicate whether they have already made the vaccine mandatory.)

  • All respondents in the Wave 31 survey indicated their organizations were experiencing staffing shortages (100%). Among organizations with multiple properties, four out of five (80%) have staffing shortages in more than half of their properties—up from two-thirds (64%) in the Wave 29 survey conducted mid-May to mid-June.

  • A total of four out of five respondents indicated that attracting community and caregiving staff (51%) and staff turnover (30%) were the biggest challenges facing their organizations today. Roughly three-quarters (72%) indicated that increasing wages was the most effective tactic.

  • All respondents are currently paying staff overtime hours (100%) up from a low of 76% in the Wave 13 survey conducted in early-October 2020. Furthermore, four out of five organizations are currently tapping agency/temp staff (84%)—a time series high. One out of five (21%) are hiring staff from other industries similar to the Wave 3 survey conducted in mid-April 2020.

  • With outlook that has remained generally unchanged since last summer, one-third of respondents (30%) in Wave 31 expect an increase in their development pipelines going forward. Among those who expect their development pipelines to increase, reasons such as current and future market demand, and continuation of expansion plans prior to the pandemic were cited most frequently.

Wave 31 Survey Demographics

Responses were collected between July 12 to August 8, 2021, from owners and executives of 70 seniors housing and skilled nursing operators from across the nation. Owner/operators with 1 to 10 properties comprise roughly two-thirds (63%) of the sample. Operators with 11 to 25 and 26 properties or more make up 19% of the sample, respectively.

  • Approximately one-half of respondents are exclusively for-profit providers (54%); more than one-third operate not-for-profit (38%) and 8% operate both.
  • Many respondents in the sample report operating combinations of property types. Across their entire portfolios of properties, 70% of the organizations operate seniors housing properties (IL, AL, MC), 34% operate nursing care properties, and 33% operate CCRCs (aka Life Plan Communities).

Owners and C-suite executives of seniors housing and care properties, please help us tell an accurate story about our industry’s performance.

The current survey is available and takes under ten minutes to complete. If you are an owner or C-suite executive of seniors housing and care and have not received an email invitation to take the survey, please contact Lana Peck at lpeck@nic.org to be added to the list of recipients.

NIC wishes to thank survey respondents for their valuable input and continuing support for this effort to bring clarity and create a comprehensive and honest narrative in the seniors housing and care space at a time when trends are continuing to change in our sector.

Skilled Nursing Occupancy Increases Further in May 2021

NIC MAP® Data Service powered by NIC MAP Vision released its latest Skilled Nursing Monthly Report on August 5, 2021, which includes key monthly data points from January 2012 through May 2021.


Medicare RPPD down 2.4% from the high set in June 2020.

NIC MAP® Data Service, powered by NIC MAP Vision, released its latest Skilled Nursing Monthly Report on August 5, 2021, which includes key monthly data points from January 2012 through May 2021.

Below are some key takeaways from NIC Analytics regarding the data.

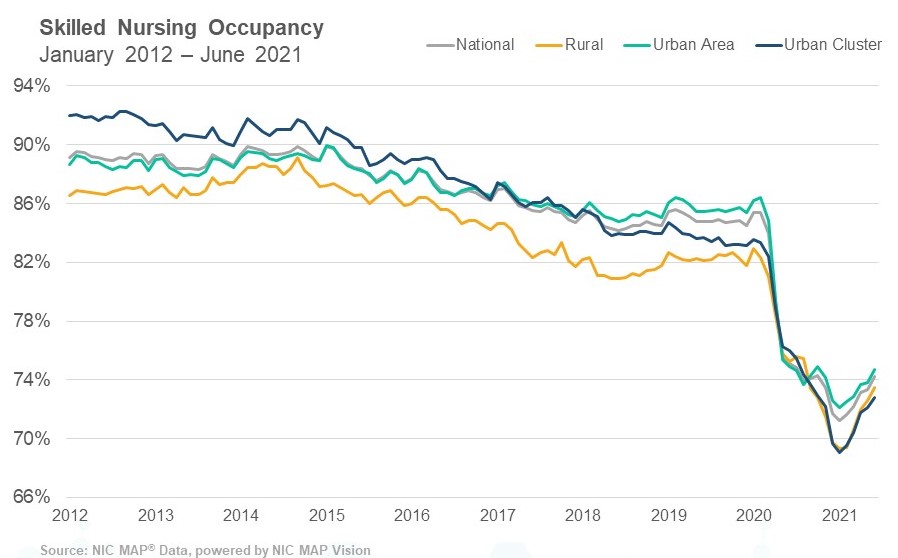
Skilled nursing property occupancy increased for a fourth consecutive month in May, albeit at a slower pace than recent monthly gains, rising 23 basis points from April to 73.4%. This placed it 211 basis points above the low point reached in January 2021. There is cautious optimism for increased occupancy through 2021, although recent news about the rapid spread of the contagious COVID-19 Delta variant is concerning. That said, the skilled nursing industry is still challenged by very low occupancy and the fact that government stimulus funds may be exhausted soon unless additional funds are provided. Hence, the question remains as to how fast the industry can increase occupancy to a sustainable level. It remains very low compared to February 2020 pre-pandemic levels of 85.5% (12.0 percentage points).

SNF Occupancy May 2021

Medicaid revenue per patient day (RPPD) decreased $2 from April to end May 2021 at $241. Medicaid RPPD continued its recent decline after hitting a high of $244 in February. However, the latest monthly data in May still represents a 3.3% increase from pre-pandemic levels of February 2020 ($233). Medicaid reimbursement has increased more than usual as many states embraced measures to increase reimbursement related to the number of COVID-19 cases. On the other hand, covering the cost of care for Medicaid patients is still a major concern as reimbursement does not cover the cost in many states. In addition, nursing home wage growth is elevated relative to inflation and staffing shortages are a significant challenge in many areas of the country.

Medicare revenue per patient day (RPPD) declined slightly from April to end May 2021 at $559. In a similar trend to Medicaid, the Medicare RPPD continued to decline after hitting a high during the initial wave of COVID-19. There was support from the federal government to aid Medicare fee-for-service reimbursements for situations such as providing higher rates to help care for COVID-19 positive patients requiring isolation. RPPD has now declined, and one possible reason is lower property-level case counts. Medicare RPPD has decreased 2.4% from the high set back in June 2020.

SNF RPPD May 2021

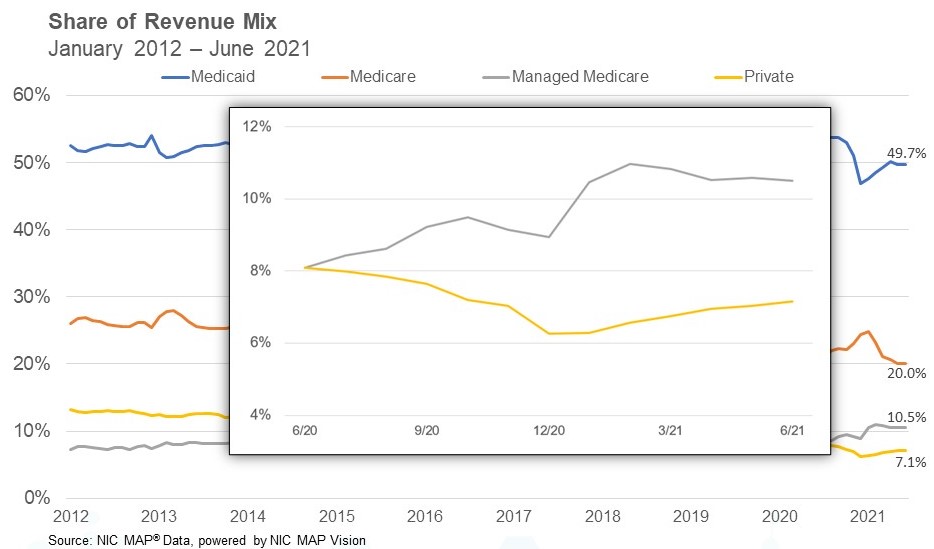
Managed Medicare revenue mix held relatively steady from April to May at 10.8%. It has declined since its recent high of 11.2% in February but was up by 250 basis points from the pandemic low set in May 2020 of 8.3%. The increase is likely due to growth in elective surgeries from the prior year. Meanwhile, Medicare revenue mix continues to decline, falling 58 basis points from April to end May at 20.4%, a time-series low. It has been falling since January 2021 when it was 25.2%, the time of peak COVID-19 cases.   The downward trend is likely due to less utilization of the 3-Day Rule waiver, which was implemented to keep COVID-19 positive patients from having to go back to the hospital.


To get more trends from the latest data you can download the Skilled Nursing Monthly Report here. There is no charge for this report.

The report provides aggregate data at the national level from a sampling of skilled nursing operators with multiple properties in the United States. NIC continues to grow its database of participating operators in order to provide data at localized levels in the future. Operators who are interested in participating can complete a participation form at https://www.nic.org/skilled-nursing-data-initiative. NIC and NIC MAP Vision maintain strict confidentiality of all data they receive.


Interested in learning more about NIC MAP data? To learn more about NIC MAP data, powered by NIC MAP Vision, and about accessing the data featured in this article, schedule a meeting with a product expert today.

Much Attention to Strong July Employment Report: Jobs Up by 943,000

The Labor Department reported that nonfarm payrolls rose by a strong 943,000 in July 2021 and an upwardly revised 938,000 in June. The consensus estimates for July had been for a gain of 858,000. Nonfarm payrolls are now up by 16.7 million since April 2020 but remain down by 5.7 million or 3.7% from pre-pandemic levels of February 2020.

The Labor Department reported that nonfarm payrolls rose by a strong 943,000 in July 2021 and an upwardly revised 938,000 in June. The consensus estimates for July had been for a gain of 858,000. Nonfarm payrolls are now up by 16.7 million since April 2020 but remain down by 5.7 million or 3.7% from pre-pandemic levels of February 2020. The data show that the U.S. recovery from the pandemic remains in place and that the hindrance on hiring from labor shortages may be easing. Its noteworthy, however, that the data collection period for the July report occurred in the first half of the month, prior to growing concerns about the COVID-19 Delta variant.

Today’s report is especially important as the Federal Reserve wants to see “substantial progress” in the economy before it shifts monetary policy to a tighter regime of higher interest rates and fewer asset purchases.   The July jump in jobs along with the significant upward revisions in June and May payrolls point to an improving labor market, a key consideration for the Fed in evaluating “substantial progress”. Further, the 4.0% annual increase in average hourly earnings will fuel concerns about inflation.

Indeed, average hourly earnings for all employees on private nonfarm payrolls rose by $0.11 in July to $30.54, a gain of 4.0% from a year earlier, up from 3.7% in June. The data suggests that rising demand for labor associated with the recovery from the pandemic is putting upward pressure on wages. That said, the Labor Department warns that the pandemic has affected the ability to fully interpret the wage data due to the wide swings in employment trends. 

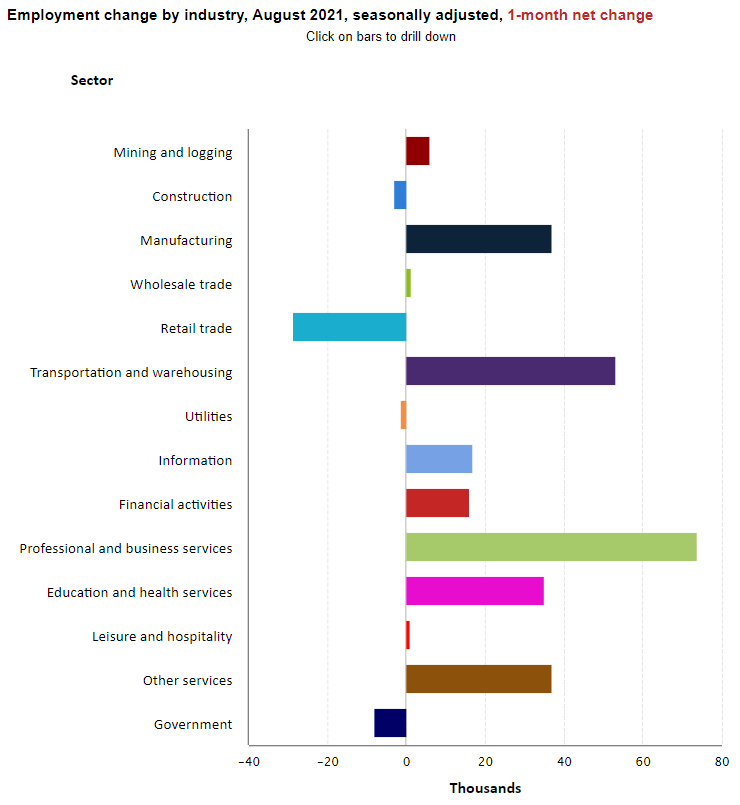
Notable job gains occurred in leisure and hospitality (380,000), local government (221,000), and professional and business services (60,000). Health care added 37,000 jobs in July. Job gains in ambulatory health care services (32,000) and hospitals (18,000) more than offset a loss of 13,000 jobs in nursing and residential care facilities. Health care employment is down by 502,000 since February 2020.  

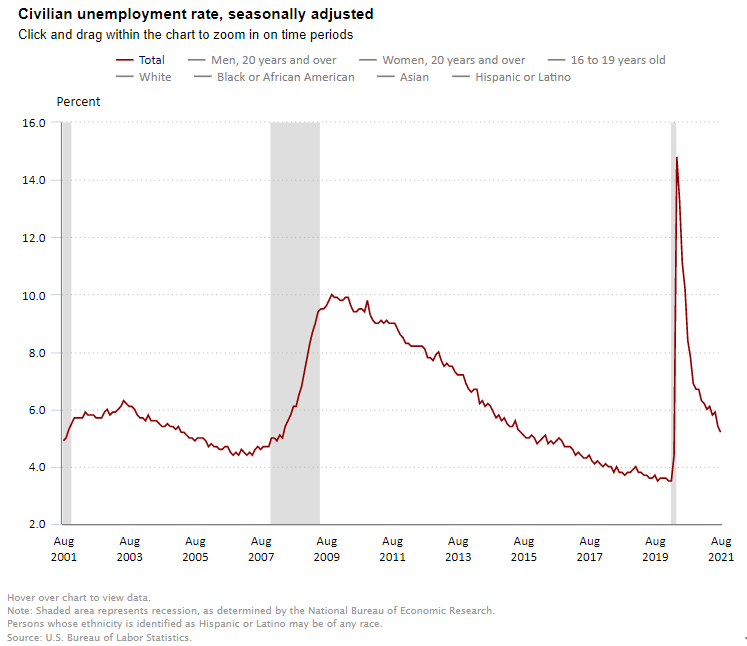
Separately and from a different survey, the Labor Department reported that the unemployment rate fell by 0.5 percentage point to 5.4% in July and the number of unemployed persons fell by 782,000 to 8.7 million. The jobless rate is now 1.6 percentage points above the pre-pandemic level of 3.5% seen in February 2020, but well below the 14.7% peak seen in April 2020. The underemployment rate or the U-6 jobless rate was 9.2% down from 9.8% in June 2021. This figure includes those who have quit looking for a job because they are discouraged about their prospects and people working part-time but desiring a full work week.  

The number of long-term unemployed (those jobless for 27 weeks or more) decreased by 560,000 to 3.4 million but is 2.3 million higher than in February 2020, suggesting that this continues to be a very challenging time for many Americans. Long-term unemployed persons account for 39.3% of the total number of unemployed persons.

The labor force participation rate, which is a measure of the share of working age people who are employed or looking for work was steady at 61.7% in July and has remained within a narrow range of 61.4% to 61.7% since June 2020. The participation rate is 1.6 percentage points lower than in February 2020. Many workers have dropped out of the labor force since the pandemic began to take care of family members or out of fear of working and catching the virus.  

The change in total nonfarm payroll employment for May was revised up by 31,000 from a gain of 583,000 to 614,000 and the change for June was revised up by 88,000 from 850,000 to 938,000. With these revisions, employment in May and June combined is 119,000 higher than previously reported. Monthly revisions result from additional reports received from businesses and government agencies since the last published estimates and from the recalculation of seasonal factors. 

Senior Living Executive Fee Stubblefield: The Workforce Is Key to Resident Satisfaction, Industry Success

The rapid growth of the older population is a bright spot for growth in senior living. But will quality keep pace with this demographic growth?

The rapid growth of the older population is a bright spot for growth in senior living. But will quality keep pace with this demographic growth?

Stubblerfield_Fee_photo_9-21-20-1“The workforce is the key to the future,” said Fee Stubblefield, founder and CEO at The Springs Living. Based in McMinnville, Oregon, the company owns and operates 18 senior living communities in the Northwest. Two new developments are underway. “Solving the workforce challenge is the number one issue impacting the quality of senior housing,” he added.

Like many industries, senior housing and care is currently struggling with a labor shortage. Competition for workers is fierce.

The uneven course of the pandemic has many of the unemployed with young children waiting to seek work until schools fully reopen. Other workers are taking time to reevaluate their job options. Some may be waiting until their personal savings run out as unemployment and federal relief payments end.

“Solving the workforce challenge is the number one issue impacting the quality of senior housing,”

Though the worker logjam may be temporary, now is the time to address the workforce issues facing the senior living industry, according to Stubblefield. “We need to think deeply about the challenge.”

Stubblefield is among the thought leaders attending the 2021 NIC Fall Conference in Houston. The Conference is NIC’s first in-person convening of leaders in senior housing and care since the pandemic began. Many industry leaders will seize the chance to share ideas with others weathering the same challenges, while simultaneously building the relationships that will help them succeed in the future.

The biggest workforce challenge is retention, according to Stubblefield. His company is able to hire people to be fully staffed. “But the industry has to figure out how to retain folks. At the end of the day, we don’t have enough job candidates,” he said.

Employee turnover adds to operating costs. More importantly, turnover affects the quality of care. “Nothing impacts resident satisfaction more directly than when a trusted caregiver leaves the job,” said Stubblefield.

Mandating higher minimum wages isn’t the answer. Instead, Stubblefield thinks more resources should be dedicated for worker benefits and career training. Those are the strategies that help retain workers. “If workers stay with us for a year, they tend to stay with us,” said Stubblefield. He added that public policies play a role in creating good jobs.

Lessons Learned
The pandemic has tested the workforce, and retention issues, like at no other time. At the outset, The Springs Living quickly pivoted operations, relying on its core value to embrace change. The number one focus was to keep people safe, both residents and workers. New infection protocols were immediately put in place and have been so successful that they will be kept going forward.

Assets were redirected to keep the staff safe, such as quickly securing personal protective equipment. “We advocate for our employees,” said Stubblefield. “That is the role of leadership.”

The company has ongoing initiatives to help retain workers. All staff are trained for their role and responsibilities. Continual education courses are provided to keep staff up-to-date and current. A leadership training program provides opportunities for front-line staff to develop the soft skills needed to grow their careers.

Mental health benefits were added to the employee insurance plan this year, and the company absorbed cost increases for employees’ health insurance. The Springs Living also offers a scholarship program for employees and immediate family members of employees.

Stubblefield’s best advice: create a supportive culture and don’t stop innovating. “We’re passionate about having an organization that people are proud to be a part of,” he said. “Happy employees mean happy residents.”

Seniors Housing Occupancy Shows Nascent Signs of Improvement at the Property Level

The recently released NIC MAP® Data, powered by NIC MAP Vision, show that the seniors housing occupancy rate remained unchanged for the aggregated 31 NIC MAP Primary Markets in the second quarter of 2021.

The recently released NIC MAP® Data, powered by NIC MAP Vision, show that the seniors housing occupancy rate remained unchanged for the aggregated 31 NIC MAP Primary Markets in the second quarter of 2021. However, a recent analysis by NIC Analytics digs further and finds a substantial rise in the share of properties with increasing occupancy rates in 2Q2021.

Notably, 47.1% of seniors housing properties within the NIC MAP Primary markets reported an increase in occupancy rates in 2Q2021 compared with 1Q2021, a relatively higher proportion compared with levels seen during the pandemic and the most since 2Q2019 (pre-pandemic levels). This shows that positive demand is returning, consumer confidence is building, and suggests that the outlook for seniors housing occupancy remains optimistic.

In this blog, we examine occupancy change at the most granular level within the NIC MAP Primary Markets aggregate and across select metropolitan markets to assess seniors housing properties’ performance and occupancy growth.

Top Findings:

  • In 4Q2020 and 1Q2021, about one-third of seniors housing properties within the 31 Primary Markets reported an increase in occupancy rates. This shows that these properties have been able to attract new residents and have been generally resilient.
  • A bit more than 47% of seniors housing properties within the NIC MAP Primary markets reported an increase in occupancy rates in 2Q2021, a relatively higher share compared with levels seen during the pandemic and the most since 2Q2019 (pre-pandemic levels).
  • Of the 31 Primary Markets, all but one saw improvements in the share of properties reporting an increase in occupancy rates in 2Q2021. Nonetheless, new inventory and dispersion in demand growth between properties continued to put downward pressure on occupancy rates across eight of the 31 Primary Markets.
  • Both inventory and the total number of occupied units for the NIC MAP Primary Markets grew by about 0.7% from 1Q2021 levels leaving the seniors housing occupancy rate for the NIC MAP Primary Markets unchanged at 78.7%. However, many individual properties experienced improved occupancy.
  • Occupancy improvement will be shaped by local patterns of inventory growth and demand, and will be influenced by the broad economy, consumer confidence, ease of development, the pandemic and vaccination rates.
  • The 68 NIC MAP Secondary Markets share of properties reporting improvements in occupancy rates increased substantially and was 50.8% in 2Q2021.
  • Detroit and Atlanta had the largest share of properties reporting an increase in occupancy rates at about 55% in the second quarter of 2021, while Baltimore had one of the smallest shares at 34.8%.
  • San Jose had a noteworthy improvement in the share of properties reporting increasing occupancy rates at 46.9% in 2Q2021, but occupancy remains very low by historic standards.

Following the onset of the pandemic in March 2020, the share of seniors housing properties reporting an increase in occupancy rates was 22.5% in 2Q2020, down from 38% in the pre-covid 1Q2020 and the lowest share since NIC began reporting data in 2005. On the other hand, 58.1% of properties reported a decrease in occupancy, the highest share since NIC began reporting data.

As the pandemic continued to evolve, the share of properties reporting an increase in occupancy rates began to gradually improve in 3Q2020 and 4Q2020. Conversely, the share of properties reporting a decrease in occupancy began to gradually decrease over the same period. In fact, based on this occupancy measure, about one-third of seniors housing properties within the 31 Primary Markets have been “pandemic-resilient” in the fourth quarter of 2020 and the first quarter of 2021.

Aggregate Market Performance. Exhibit 1 below shows that seniors housing properties began to see promising signs of rebound in 2Q2021. This has translated to improvements in occupancy rates within 47.1% of seniors housing properties within the aggregated 31 NIC MAP Primary Markets average and across twenty of the 31 Primary Markets.

Notably, the share of properties reporting an increase in occupancy rate improved across 30 of the 31 Primary Markets in the second quarter of 2021, although aggregated occupancy for seniors housing in the Primary Markets was unchanged at 78.7%. This is largely due to new inventory and dispersion in demand growth between properties. Both inventory and the total number of occupied units for the 31 Primary Markets grew by about 0.7% from 1Q2021 levels.

At the market level, 8 of the 31 Primary Markets saw continued downward pressure on occupancy rates. New inventory is an important factor driving occupancy growth. As positive demand continues to build momentum and net absorptions exceeds inventory growth, the NIC MAP Primary Markets aggregate should begin to see an improvement in occupancy, but the recovery is likely to vary by market according to variations in local supply and demand conditions.

Exhibit 1 – Share of seniors housing properties by occupancy change within the NIC MAP Primary Markets.

Market-Specific Performance. From 1Q2020 to 1Q2021, about 18% of properties within the 31 Primary Markets and 18% of properties within the 68 Secondary Markets aggregates reported an increase in occupancy rates. In 2Q2021, the shares of properties reporting improvements in occupancy rates from 1Q2021 for the 31 Primary Markets and 68 Secondary Markets increased substantially and was 47.1% and 50.8%, respectively.

Drilling deeper into select metropolitan markets within the NIC MAP Primary Markets, Detroit and Atlanta had the largest share of properties reporting an increase in occupancy rates at about 55% in the second quarter of 2021, while Baltimore had one of the smallest shares at 34.8%. In fact, occupancy in Baltimore continued to slip further from 81.1% in 1Q2021 to 79.6% in 2Q2021. The occupancy drop in Baltimore was largely due to negative absorption.

Interestingly, San Jose, one of the hardest-hit markets during the pandemic, had a noteworthy improvement in the share of properties reporting increasing occupancy rates in 2Q2021. The average occupancy rate in San Jose improved by 0.4pps from 83.3% in 1Q2021 to 83.7% in 2Q2021 but remains 11.1pps below March 2020 levels and very low by historic standards. The slight improvement in occupancy rates in San Jose was mainly driven by negative inventory growth associated with units being pulled off the market.

Exhibit 2 – Share of seniors housing properties by occupancy change within the NIC MAP aggregates and select metropolitan markets.

image-png-Jul-29-2021-05-53-35-69-PM

The path of future occupancy patterns is going to be shaped by supply-demand balances, and the full recovery depends on the course of the pandemic, vaccination rates, economic growth, ease of development and a restoration of consumer confidence.

To learn more about which of the NIC MAP Primary Markets performed better at the property level during the pandemic and to learn more about NIC MAP Data, powered by NIC MAP Vision, and the additional underlying data only available to NIC MAP clients, schedule a meeting with a product expert today.