Lorem Ipsum
Your Blog Post Title Here…
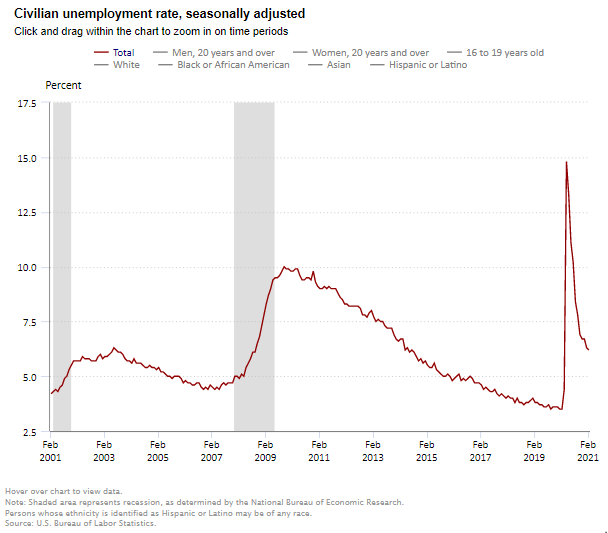
U.S. Jobs Increase by A Strong 379,000 in February
The Labor Department reported that nonfarm payrolls rose by 379,000 in February and that the unemployment rate edged lower to 6.2% from 6.3% in January.
The Labor Department reported that nonfarm payrolls rose by 379,000 in February and that the unemployment rate edged lower to 6.2% from 6.3% in January. The jobless rate remains 2.7 percentage points above the pre-pandemic level of 3.5% seen in February 2020, but well below the 14.7% peak seen in April. Despite the February increase, job levels are 9.5 million below the pre-pandemic levels of February 2020 (6.2%), with 3.5 million of that gap in the leisure and hospitality sectors. The consensus estimates for February had been for a gain of 200,000.
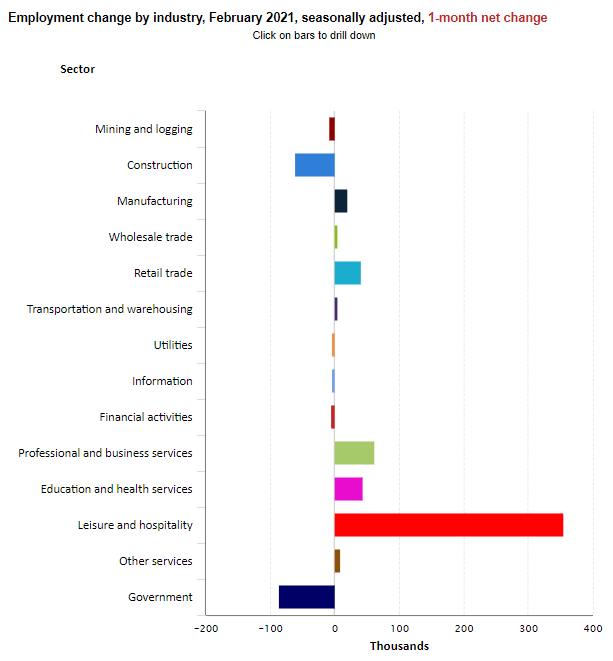
Private service-producing jobs increased by 513,000, led by a rise of 355,000 jobs in leisure and hospitality payrolls as pandemic-related restrictions began to be relaxed and restaurant re-openings occurred. Health care added 20,000 jobs in January; this followed a loss of 85,000 in January. Nursing care facilities lost 12,000 jobs in February.
The number of long-term unemployed (those jobless for 27 weeks or more) was little changed from January at 4.1 million but is 3.0 million higher than year-earlier levels, suggesting that this continues to be a very challenging time for many Americans. Long-term unemployed persons account for 41.5% of the total number of unemployed persons.
The underemployment rate or the U-6 jobless rate was unchanged at 11.1% in February. This figure includes those who have quit looking for a job because they are discouraged about their prospects and people working part-time but desiring a full work week.
Average hourly earnings for all employees on private nonfarm payrolls rose by $0.07 in February to $30.01, a gain of 5.3% from a year earlier. These increases largely reflect the disproportionate number of lower paid workers in leisure and hospitality who went off payrolls, which put upward pressure on the average hourly earnings estimates.
The labor force participation rate, which is a measure of the share of working age people who are employed or looking for work was steady at 61.4% in February.
The change in total nonfarm payroll employment for December was revised down by 79,000 from a loss of 227,000 to a loss of 306,000 and the change for January was revised up by 117,000 from 49,000 to 166,000. Combined, 38,000 jobs were added to the original estimates. Monthly revisions result from additional reports received from businesses and government agencies since the last published estimates and from the recalculation of seasonal factors.
The February data is promising and reflects a gradual reopening of parts of the economy and some of the effects of the $600 stimulus checks. The ongoing drop in COVID cases, the widespread distribution of vaccines, and a shift in consumer confidence is needed to allow for a more complete re-opening of the economy and a fuller recovery in jobs. If the $1.9 trillion stimulus package becomes law, further economic activity and additional job growth can be expected in the coming months.
The Art and Science of Lending: A Conversation with Capital One’s Mark Bultman
Capital One's Mark Bultman’s approach to seniors housing finance combines art and science. You can’t have one without the other.
The most successful businesses are a blend of art and science. Data provides a solid foundation. Creativity delivers the innovative solutions.
Mark Bultman’s approach to seniors housing finance combines art and science. You can’t have one without the other.
As senior vice president of sales, Bultman is a leader on the seniors housing lending group at Capital One. NIC Chief Economist Beth Mace recently talked with Bultman about his approach and whether the market is headed for an upturn after a difficult year. Here’s a recap of their conversation.

Mace: What’s your role at Capital One?
Bultman: I work in the long-term care real estate lending group at Capital One. We provide financing in the seniors housing space for independent living, assisted living, memory care, and to a lesser extent, skilled nursing properties.
Mace: How active is Capital One in the sector?
Bultman: Our team has been lending in the space for close to 20 years and has been very active as a balance sheet transactional lender and as a longer-term agency lender. While we’ve still seen activity since COVID-19 hit, there have been fewer trades across the market as a whole.
Mace: Did business pick up in 4th quarter of last year compared to previous quarters?
Bultman: Yes, we’re seeing more deals as 2021 gets started, but activity is down overall and a far cry from 2018-19 and first quarter of 2020.
Mace: Are you anticipating greater deal flow as 2021 progresses?
Bultman: I’m optimistic that there will be more deal opportunities in 2021. We are on the phone with owners and operators weekly, if not daily, and I think there will be a greater desire to transact, buy and sell, and refinance loans. There are a lot of factors at play that will dictate the level of deal flow as we move forward—the vaccine roll out, state and operator-specific rules for visits and move-ins, trends in the property-level workforce, just to name a few.
Mace: A lot of lenders worked hand-in-hand with their borrowers during 2020 to help them through the challenges they were facing. Will that continue into 2021?
Bultman: Absolutely. We’ve worked closely with our borrowers to help them navigate their individual situations. The pandemic has been really tough for the industry, and not just in terms of lost revenue and higher expenses. When you talk to customers on a weekly basis, you can hear the strain in their voices. You can feel the struggle for the staff and the residents. You have to take that into consideration, and we’ve been committed to supporting them through this difficult stretch.
Mace: Is there any difference in the way you underwrite and view seniors housing compared with other asset types within your healthcare real estate business?
Bultman: I would say we’re fairly data-driven in our underwriting approach. There’s a ton of data out there, and we use it all. We look at recent trades and industry trends to assist with the science of real estate underwriting. But we also look at the art of underwriting. Are we aligned with the borrower? Are we aligned on the long-term outlook for the property and the market? Our underwriting philosophy is a blend of the art and the science. Seniors housing is an operating platform on top of a piece of real estate. The hard part is figuring out both parts of the business and aligning with the right players in the industry.
Mace: Do you finance acquisitions, refinancings, re-positionings and new development?
Bultman: We finance all of the above. Our group has been financing seniors housing for close to 20 years. Right now, we’re more focused on acquisitions, refinancings, and agency lending. That’s been our core competency over the past few years and where our expertise lies. We finance a limited amount of new construction and repositionings but will continue to look for the right opportunities across all deal types.
Mace: What do you look for in a sponsor?
Bultman: Aligned interests. We are committed to the industry, and we’re looking for sponsors also interested in being in seniors housing for the long term. We aren’t looking for a buy-and-flip type of sponsor, or one that’s chasing yield. Over the years, we’ve been financing the biggest REITs in the space, the smaller owner operators, and everything in between. We are always looking for sponsors and owners that are focused on operations. Seniors housing is a boots-on-the-ground business and that determines success in this industry. Our customers have historically been well- known and well-regarded sponsors who partner with top operators. We’ve been very successful in lending to these types of groups over the years.
Mace: How do you decide what lending product is the right fit for a borrower?
Bultman: In a perfect world, we are able to present multiple lending options for our customers and then work with them to find the best fit. That being said, there are situations where it’s fairly obvious that one type of product will better meet the needs of the customer. If the borrower wants a longer-term deal and the property is stabilized, then an agency loan might be the clear choice. A shorter-term deal or the purchase of a pool of assets with different exit strategies, capex needs, etc., might be a better fit for a balance sheet loan. We are fortunate to have the ability to offer multiple lending solutions, and it’s been a big factor in our success. We were proud to be named the top Freddie Mac seniors lender in 2020 – a fantastic accomplishment and a testament to our industry presence and best-in-class agency lending team.
Mace: What else would you like our readership to know about Capital One?
Bultman: At Capital One, our goal is to find ways to add value for our customers and the market, and to build relationships. We have had tremendous success as transactional lenders in seniors housing, and we will continue to be leaders in the space. One exciting thing we are working on this year is improving and expanding our traditional bank product offerings (treasury services, depository services, payment cards, etc). There’s a need in the industry for banking services tailored to seniors housing, and we’re utilizing our industry knowledge and banking expertise to bring better solutions to market.
One last thing, if I may, Beth. It’s been hard to watch how this pandemic has affected our industry. For someone who’s been in seniors housing for 20 years, this is the worst year that I’ve seen in terms of the overall impact on the properties themselves. I’m thankful for all the hard work being done to figure this out in real time, to keep residents and staff safe and uphold the industry’s reputation. Seniors housing is a fantastic industry and great product, and I’m thankful and fortunate to be a part of it.
Per-Resident Rate of COVID-19 Infections Reaches Pandemic Record Low Point as Case Counts Continue to Dip
NIC’s Skilled Nursing COVID-19 Tracker, featuring the most up-to-date CMS data as of February 14, 2021, shows that the per-resident rate of new COVID-19 infections in skilled nursing facilities continued to fall and reached a pandemic record-low point on February 14 (0.34%).
NIC’s Skilled Nursing COVID-19 Tracker, featuring the most up-to-date CMS data as of February 14, 2021, shows that the per-resident rate of new COVID-19 infections in skilled nursing facilities continued to fall and reached a pandemic record-low point on February 14 (0.34%). This was 0.20 percentage points below the previous nadir of 0.54% reached eight months ago on June 21, 2020 and was down 2.69 percentage points from 3.03% at its peak on December 20.
Regionally, the lowest rate of new infections was seen in the Midwest at 0.22% – a pandemic low, followed by the West (0.23% – a pandemic low), the South (0.41% – a pandemic low), and then the Northeast (0.43%).
As of February 14, 2021, about 16 million Americans have received 2 doses of the COVID-19 vaccines in the U.S, and about 1.7 million people have been fully vaccinated in the Federal Pharmacy Partnership Program for Long-term Care.
Recent F.D.A. authorization of the Johnson & Johnson single-shot vaccine gives more hope and suggests that the worst of the pandemic maybe behind us. The characteristics of this new single-shot vaccine are a game changer and should increase vaccination numbers significantly.
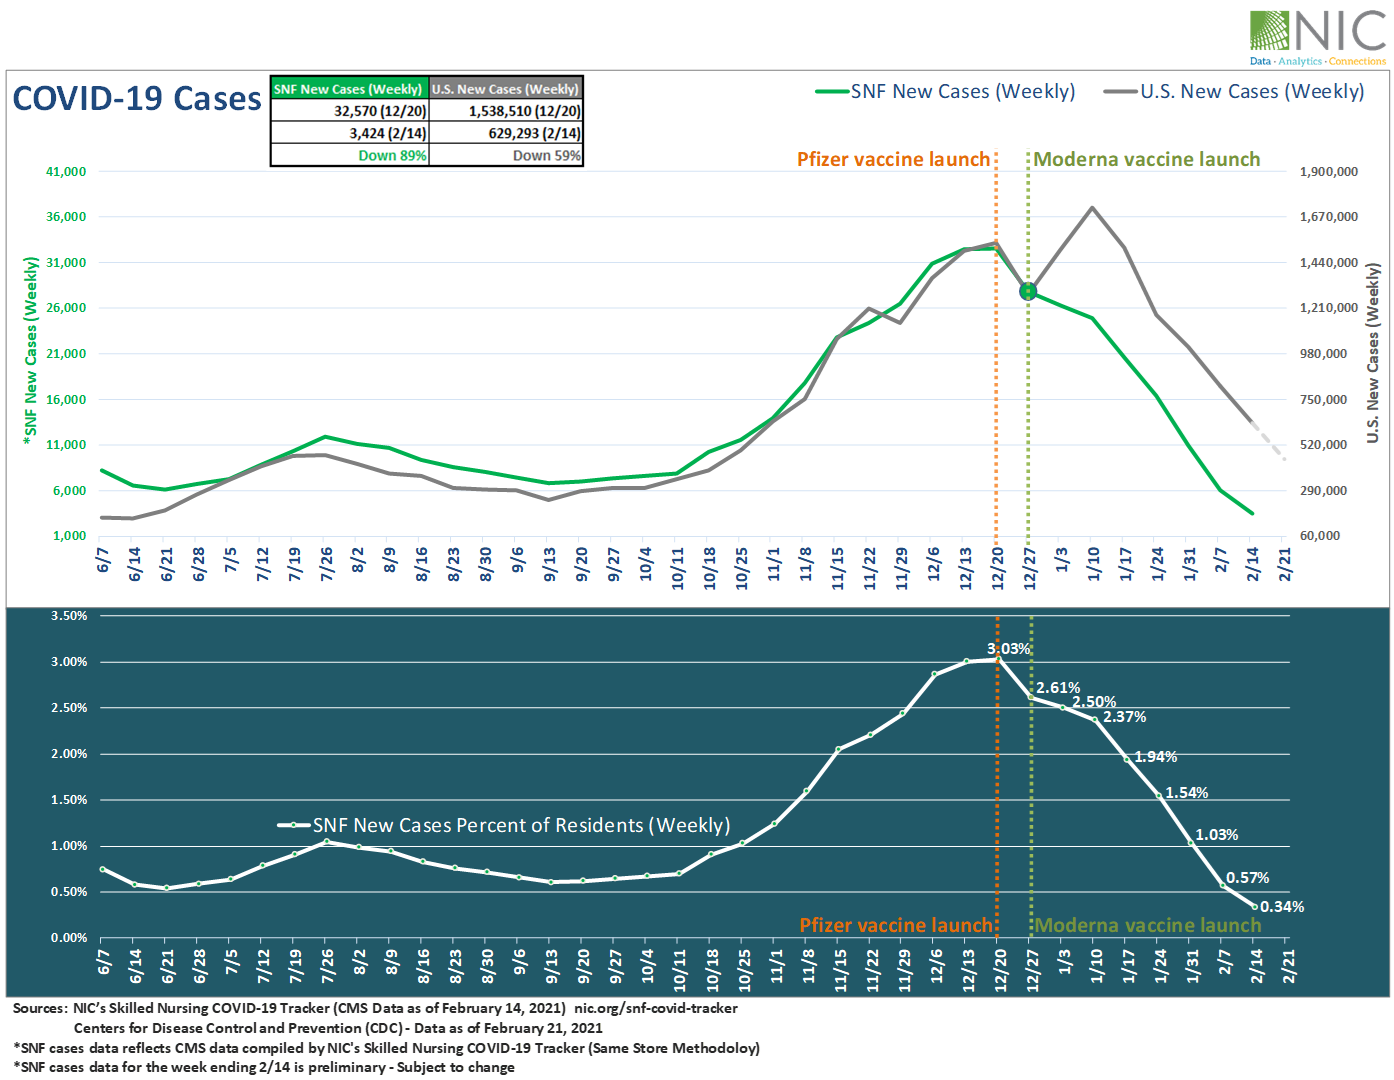
Exhibit 1 below shows that weekly confirmed cases within skilled nursing facilities are down 89% from the December 20 peak, while U.S. new cases declined by 59% over the same period.
Exhibit 1 – Weekly COVID-19 Cases in Skilled nursing (SNF) vs. U.S.
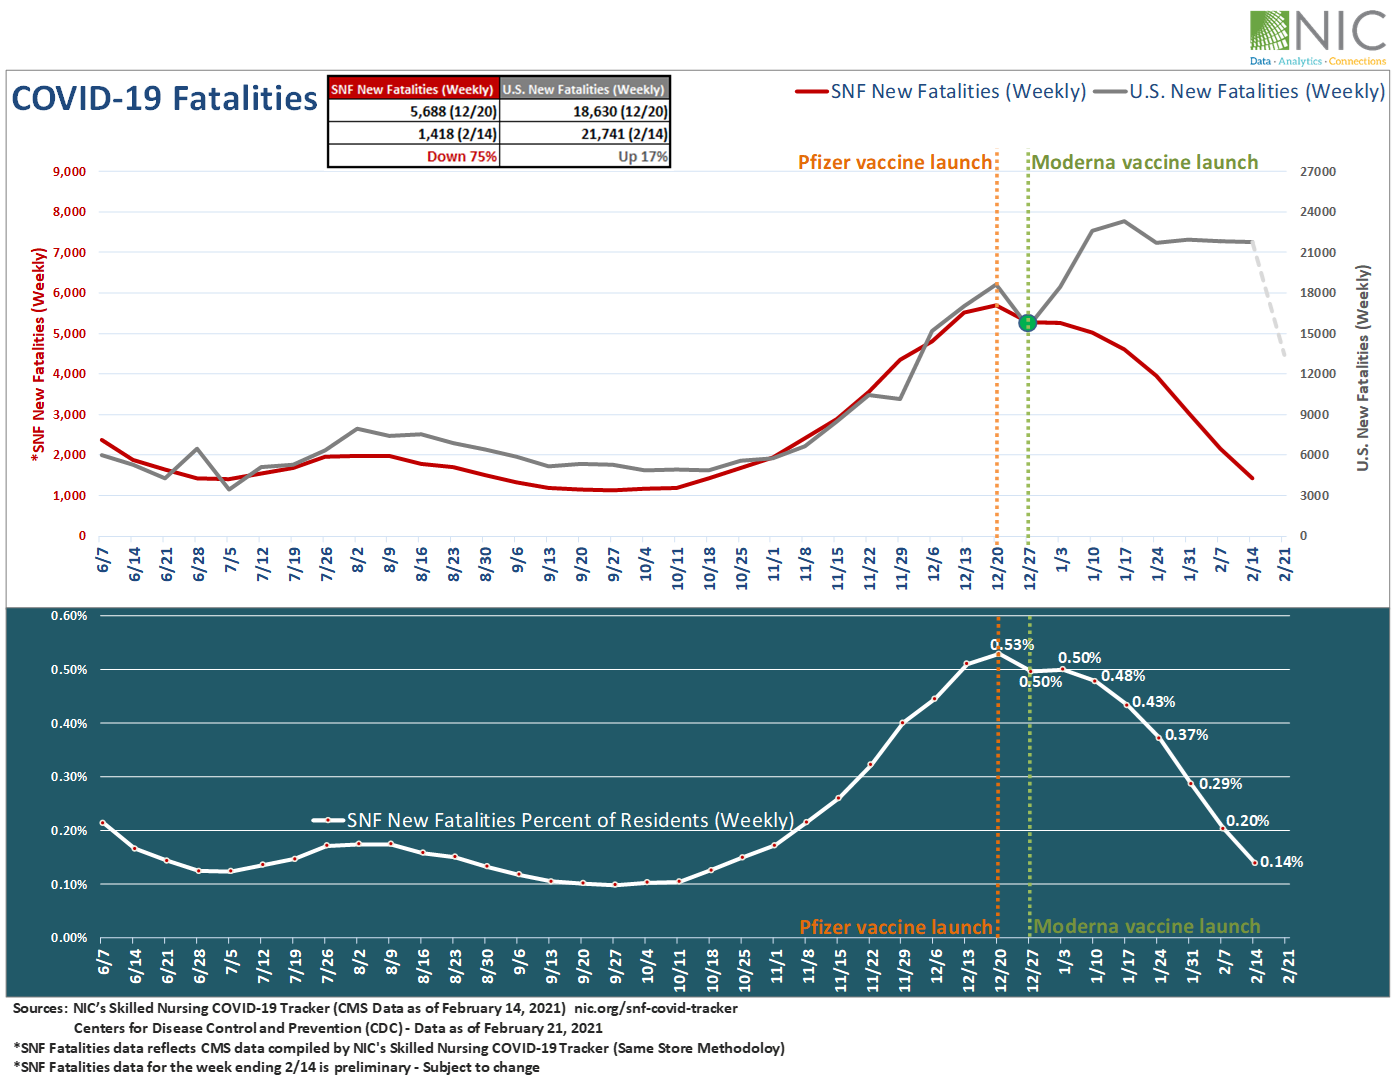
As shown in Exhibit 2 below, weekly fatalities are down 75% in skilled nursing facilities since the launch of the Long-Term Care vaccination program on December 20. Sadly, U.S. weekly COVID-19 fatalities increased by 17% over the same period, according to the CDC. However, U.S weekly fatalities on February 21 fell more sharply than at any previous point—down 38% from the week ending February 14, 2021.
New fatalities in skilled nursing facilities as a share of total fatalities in the U.S. measured approximately 10% on February 7 and 7% on February 14 (data for the week ending February 14 is preliminary). These shares are the lowest recorded since CMS began reporting data in late May 2020.
Exhibit 2 – Weekly COVID-19 Fatalities in Skilled Nursing (SNF) vs. U.S.
“The week-over-week improvement in infections and death rates since late December is certainly welcome relief to the pandemic battle, we have been fighting for nearly one year,” said NIC Chief Economist, Beth Mace. “And the introduction of a third vaccine provides even further promise and hope that we may be nearing the end of the worst parts of this crisis. That said, the seniors housing and nursing care sectors have forever shifted and many of the protocols put into place during the past 12 months are likely to remain in place.”
Positive signals are palpable in Wave 22 results from the latest NIC Executive Survey Insights, which collected survey results from February 8 – 21, 2021. The survey results show that 50% of organizations with nursing care beds reported increasing occupancy rates in the past 30 days.
To gain in-depth insights and track the week-over-week change rate for new resident cases and fatalities of COVID-19 within skilled nursing facilities at the state and county levels, visit NIC.org. You can also access the Skilled Nursing COVID-19 Tracker along with a rich trove of analysis and insight on the NIC COVID-19 Resource Center.
For more reading on the effects of vaccines in skilled nursing facilities, see the following blogs:
New COVID-19 Cases in Skilled Nursing Continue Decline, Far Steeper than U.S. Overall Cases (Published on February 23, 2021)
Rate of New COVID-19 Infections in Skilled Nursing Facilities Continues to Plummet* (Published on February 17, 2021)
COVID-19 Case Counts Falling in Skilled Nursing Properties Following Vaccine Rollout (Published on February 9, 2021)
NIC is committed to provide timely data, analyses and insights that increase transparency and understanding of the sector, especially in this difficult time of COVID-19. We strongly support all actions and efforts that prioritize distribution of COVID-19 vaccines, testing, and availability of PPE to protect frontline workers and residents.
Is There an Investment Case for Skilled Nursing in the Intra-and Post-Pandemic World?
How will the nursing home industry emerge from the pandemic? In the latest NIC Leadership Huddle event, expert panelists discuss the skilled nursing sector’s short-term and long-term impact on property valuations.
With all-too-frequent headlines of “nursing home deaths,” federal and state deficits, increased competition from home health agencies, and historic low occupancy levels while wage pressures continue – how will the nursing home industry emerge from the pandemic? In the latest NIC Leadership Huddle event, expert panelists, and then attendees in small groups, joined a spirited discussion on the skilled nursing sector’s short-term and long-term operational challenges and the impact on property valuations.

The event titled “Is There an Investment Case for Skilled Nursing in the Intra-and Post-Pandemic World?” began as always with expert commentary from experienced leaders in the space. In a short presentation, Colleen Blumenthal, MAI, chief operating officer/partner, HealthTrust pointed to some pre-pandemic slides indicating that demand was declining before COVID-19 hit the U.S. She also pointed out that a search in Google for “nursing home deaths” now yields over 150 million hits. She said, “It feels like there’s been a complete barrage of headlines, starting with Lifecare Center of Kirkland back in March, and it’s still continuing to this day.” She continued, “It’s a stigma that’s going to impact everyone in the nursing home sector, not just those that did not provide the standard of care that we expect.”
Blumenthal, explaining the impact of COVID-19 on the sector, pointed to CMS’s decision to limit visitations to nursing homes, among other factors. While likely saving lives, the policy negatively impacted many residents and their families, many of whom were left living in isolation for much of 2020. The policy also made it difficult for buyers and lenders to evaluate and transact on properties. Occupancy rates, which declined across the entire seniors housing and care industry, dropped more dramatically for nursing care than other sectors. Blumenthal observed that skilled nursing occupancy rates, which had been around 80% nationwide pre-pandemic, are now ranging from 55%-80%, with widely varying numbers across the fifty states.
Closing her self-described “Debbie Downer” introduction, Blumenthal pointed to pricing, which remained fairly steady, at around $100,000 per bed in 2020. That, she suggested, reflects sustained investor interest in the sector. With that, she asked panelists Wendy Simpson, chairman & CEO, LTC Properties, Inc., and Ben Reisman, senior vice president of Finance, TL Management, why they remain attracted to skilled nursing. They had similar responses. Both feel that the services provided by these businesses are needed and will continue to be supported by reliable government payers. In addition, according to Reisman, there are opportunities for investors to “stay ahead of the curve” by investing in new technologies, treatments, and other innovations.
2020 saw a pause in deal-making, as many investors focused on helping their operators weather the pandemic. This year, according to Reisman, deals are happening again. Simpson also is seeing an uptick in activity so far this year, saying, “We’re finding a relatively slow start to the year, but things are feeling a little bit better, as the spring comes along, than before.”
Both panelists pointed to difficulties finding lenders. Reisman said, “Lenders are going to look for very strong borrowers, which they always do, but will be more important now because they know, and we know that you can’t just say ‘there’s a vaccine’…to get back to pre-pandemic levels is going to take a long time.” That focus may result in fewer, and smaller, deals happening in the short term.
The deals that do get done may rest on the quality and reputation of the operator. “I think the industry is more interested in the operator now than necessarily the asset,” said Simpson. She continued, “You know, in real estate it’s ‘location, location, location,’ well, in investing it’s ‘operator, operator, operator.’” She indicated her company would like to help existing, trusted operators expand their portfolios.
Asked about the high numbers of prospective residents switching to home health care, neither panelist sees a long-term problem for skilled nursing. Rather, Reisman sees a temporary shift driven by the pandemic, followed by a return to congregate settings. Saying, “Isolation is a horrible thing,” he explained that current nursing home residents are isolated, but that, as group activities and visitation return, and people return to work and school, “that might flip.” He explained, “Even if people are reading the news and are scared today, in a few months or a couple of years, when they’re making a decision, talking to their doctor who’s recommending a nursing home as the best place for them to get better, I think a lot of that fear can easily go away, if we do a good job of communicating that.”
On the same question, Simpson pointed to skilled nursing’s investments in rehab facilities, as well as shortages of labor. She said, “Even before the pandemic, we didn’t have enough of an employee base, so if you take all of these people who are going to be able to see one or two patients a day, because of the travel between patients, and that person could see four to six people in a nursing home – I just don’t see how that math works.” She believes that home health will appeal to high income patients who can afford expensive round-the-clock nursing care at home, or strong families who can provide such care themselves. She argued, “that’s just not the United States.”
It should be noted here that in the follow-up discussion several attendees took a different view of the impact of home health care. Some small groups were unable to agree on whether the trend will be short term or have a lasting impact on long term care occupancy rates. If there was general agreement, it was on the fact that, for now, skilled nursing valuations are holding steady.
Another consideration for underwriters will be the relative health of state Medicaid systems, as well as the healthcare networks that refer patients. The panel discussed Texas, an example of a state with a rapidly growing population – but that has some of the lowest Medicaid reimbursement rates in the nation. In some smaller Texas markets hospitals have gone many months without referring rehab patients – a real concern for investors in an industry that often depends on those referrals for survival. Again, according to the panelists, they will be looking at the operator as they consider these and other investments.
Another potential source of trouble is rising insurance and liability costs driven by the pandemic. The panel suggested they will look at tort-reform laws and the litigation environment in any given state as part of their underwriting process.
The panel also discussed the trend towards reducing the numbers of beds in facilities, and the recent Ohio bed buy-back program. “Ohio may give up a thousand beds, but none of those beds were in service,” pointed out Simpson. She said, “I think there’s more value in the private room, if its available, but there’s always going to be need for at least double occupancy in properties.”
Immediately following the panel discussion, attendees hopped onto a group Zoom video meeting to discuss further. After a general discussion, attendees were divided into smaller breakout groups, and asked to address two questions: Has the pandemic inherently eroded skilled nursing values? And, where do occupancy/census levels stabilize, and how long will it take to get there? As noted above, discussion was frank and spirited – and not everyone in attendance was in agreement. However, when everyone returned to the larger group discussion and reported out their findings, the general sense was that, despite all the bad news of the past year, and despite disagreements on how deep and lasting the impact will be, there is still plenty of value in skilled nursing – and there will likely be more in coming months and years.