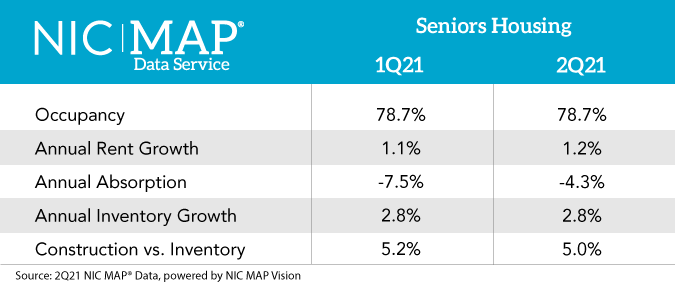
Occupancy unchanged as inventory increased in second quarter
Senior housing occupancy remained flat in the second quarter of 2021, holding at 78.7 percent, according to new NIC MAP® data, powered by NIC MAP Vision. Though COVID-19 cases in senior living properties dropped significantly in the last quarter, occupancy has not turned the corner, largely due to new inventory coming online.
Despite unchanged occupancy, demand for senior housing improved in the second quarter. NIC MAP reported the first positive quarterly absorption – the number of units leased on a net basis – since the first quarter of 2020 and the most positive absorption since 2019.
“Second quarter data confirms anecdotes that occupancy at many properties improved as move-ins accelerated thanks to limited property-level COVID-19 infections,” said NIC’s chief economist, Beth Burnham Mace. “However, inventory grew and outpaced demand, and that’s why we aren’t seeing an occupancy uptick.”
Assisted living and independent living properties both experienced little change in occupancy, with independent living holding steady at 81.8 percent, and assisted living inching up to 75.5 percent. San Jose (83.7%), Portland, OR (83.4%), and San Francisco (83.4%) had the highest occupancy rates of the 31 metropolitan markets that encompass NIC MAP’s Primary Markets. The markets experiencing the lowest occupancy rates included Houston (73.0%), Atlanta (74.8%), and Las Vegas (74.9%).
A deeper look at the data show that a growing number of operators are reporting occupancy increases. In the second quarter of 2021, 47 percent of senior housing properties in the NIC MAP Primary Markets reported an increase in occupancy. During the height of the pandemic, that number was 22.5 percent.
“Some areas of the country are seeing senior housing occupancy improve, but the data show that we haven’t fully turned the corner,” said Chuck Harry, NIC’s chief operating officer. “Senior housing occupancy remaining unchanged suggests that it will likely take more time to see broad, nationwide improvement to the levels prior to the onset of the pandemic.”
There is a wide gap in performance between markets in NIC MAP’s Primary Markets. In Atlanta and Detroit, 55 percent of properties reported overall occupancy improvement. Just 33 percent of properties in Chicago reported occupancy improvement.
A summary of the NIC MAP Data Market Fundamentals, released by NIC MAP Vision is below. Click here for the complimentary version of the Market Fundamentals report, which will be available at 4:30 p.m. ET.
###
About the National Investment Center for Senior Housing & Care
The National Investment Center for Seniors Housing & Care (NIC), a 501(c)(3) organization, works to enable access and choice by providing data, analytics, and connections that bring together investors and providers. The organization delivers the most trusted, objective, and timely insights and implications derived from its analytics, which benefit from NIC’s affiliation with NIC MAP Vision, the leading provider of comprehensive market data for senior housing and skilled nursing properties. NIC events, which include the industry’s premiere conferences, provide sector stakeholders with opportunities to convene, network, and drive thought-leadership through high-quality educational programming. For more information, visit natinvcenterdv.wpengine.com and follow NIC on Twitter, LinkedIn, and Facebook.
About NIC MAP Vision
NIC MAP Vision is a leading provider of comprehensive market data for the seniors housing and care sector. NIC MAP Vision brings together two strong, well-respected, and complimentary teams and platforms – the market-leading NIC MAP® Data Service (NIC MAP) and VisionLTC’s best-in-class market research analysis platform. For more information, visit www.nicmapvision.com.