Roughly 3,200 senior housing and care operators, investors and industry professionals traveled to Austin, TX earlier this month to attend the 2025 NIC Fall Conference. Upon check-in, all registrants were asked to rate their overall outlook for senior housing and care in the year ahead. This NIC Industry Sentiment Poll was first launched at the 2024 NIC Spring Conference and has been repeated at each major NIC conference ever since. As detailed in the graph below, the overall outlook of industry participants is the highest it has been since the poll’s inception.
Ninety-two percent (92%) of the almost 2,900 respondents reported an “Extremely Positive” or “Positive” outlook for the year ahead, which is 2.8% above the industry sentiment measured just six months ago at the NIC Spring Conference. Despite acknowledged headlines related to potential tariff impacts, subdued development activity, and a potential supply-demand gap, the energy and optimism were evident throughout the three days of the conference.
The NIC Research and Analytics team will once again measure the industry outlook at the 2026 NIC Spring Conference scheduled for March 30-April 1in Nashville, TN. Be on the lookout for registration information later this year.
Choice vs. Necessity: Why Independent Living Holds Pricing Power in 2025
The pricing power in senior housing is no longer uniform; it is stratified by segments and shaped by turnover, affordability pressures, and the balance between choice and care necessity.
The second quarter of 2025 reinforced an important theme for the senior housing industry. Independent living (IL), as a choice-based segment, is achieving the strongest rent growth and the lowest reliance on discounts, while need-based care segments – assisted living (AL) and memory care (MC) – are grappling with rising discounting practices and tighter affordability constraints. Pricing power is increasingly a function of turnover dynamics and resident ability to pay. Segments with longer lengths of stay and lower reliance on concessions, most notably IL, are not only delivering stronger returns today but also feeding demand into the next stages of the care continuum.
Despite these variations in pricing, absorption across all segments remained positive, with move-ins exceeding move-outs for the 17th consecutive month. These positive absorption patterns highlight resilient demand, although in AL and MC that strength is coming at the cost of deeper concessions.
Independent Living Segment: A Standout Performer in Rent Growth
IL is emerging as the clear leader in rent growth. Asking rates increased by 6.7% and in-place rents rose by 9.1% year-over-year as of June 2025, but the most striking development was in initial rates, which surged 16.9% to a record high. Equally notable, discounts narrowed sharply. On average, residents moved in at rates only $298 below asking in June 2025, equivalent to 0.8 months of rent on an annualized basis. One year earlier, that gap was more than double ($634, equivalent to 1.8 months).
The combination of higher rent growth and lower discounts reflects not only strong market demand but also the positioning of IL as a lifestyle choice, where residents are willing and able to pay for independence and amenities. Importantly, IL residents are often tomorrow’s AL and MC residents, meaning today’s strength in IL rent growth is also a leading indicator of the type of demand moving through the care continuum.
Assisted Living Care Segment: Moderate Rent Growth but Rising Discounts
By contrast, the AL segment delivered more moderate rent growth, highlighting its positioning as a need-based segment. Asking and in-place rents increased by 5.9% and 5.5%, respectively, while initial rents rose just 4.2% from year-earlier levels. At the same time, discounts widened to $673, or about 1.2 months of rent, compared with one month the prior year.
These trends suggest that while demand remains steady, operators are leaning on greater concessions to further drive move-ins and balance affordability. For many families, AL is a need-based decision made under financial constraints, which heightens price sensitivity and limits how much operators can push rents before turning to discounts.
Memory Care Segment: Rent Growth Deceleration and Affordability Pressures
MC, meanwhile, is experiencing the sharpest slowdown. Asking rents grew 5.1% year-over-year in June 2025, down from 5.8% in 2024. Initial rates rose by just 2.2%, less than half the pace of the previous year. Discounts widened considerably, averaging $898, or 1.2 months on an annualized basis, up from 0.9 months last June.
With a median stay of only 18 months, MC remains the shortest-tenure segment, and higher turnover is increasingly translating into deeper discounts.
Additional key takeaways are available to NIC MAP subscribers in the full report.
About the Report: The NIC MAP Seniors Housing Actual Rates Report provides aggregate national data from approximately 300,000 units within more than 2,500 properties across the U.S. operated by over 50 senior housing providers. The operators included in the current sample tend to be larger, professionally managed, and investment-grade operators as a requirement for participation is restricted to operators who manage 5 or more properties. Visit the NIC MAP website for more information.
###
CCRC Performance 2Q 2025: Entrance Fee vs. Rental CCRCs
The following analysis examines the broader occupancy trends, year-over-year changes in inventory, and same-store asking rent growth – by care segment – within 1,054 entrance fee and rental CCRCs in the 99 NIC MAP Primary and Secondary Markets.
2Q 2025 Unit Type Distribution in Entrance Fee vs. Rental CCRCs
The exhibit below explores the distribution of unit type across entrance fee and rental CCRCs, revealing a greater prevalence of independent living units in entrance fee CCRCs.
In Entrance Fee CCRCs, the data showed that independent living units represent 65.7% of the total inventory in the second quarter of 2025 – the largest share across all care segments and payment types. This was followed by nursing care (18.1%), assisted living (12.2%), and memory care (3.9%).
Entrance fee CCRCs typically attract residents who plan ahead for long-term needs, often moving in and choosing independent living as their initial option while still relatively healthy, active, and not in need of daily assistance. Over time, as their care needs increase, they may transition to other care segments, but the majority of inventory remains independent living.
In Rental CCRCs, independent living (39.4%) and nursing care (38.2%) each represent a notable share of inventory, while assisted living accounts for 17.4%, and memory care for 4.9%, of inventory.
The near-even split between independent living and nursing care in rental CCRCs suggests a different dynamic. The relatively lower financial barrier may attract residents who delay moving in until they require more care, leading to a higher proportion of assisted living units, memory care units, and nursing care beds, compared to entrance fee CCRCs.
2Q 2025 Market Fundamentals by Care Segment – Entrance Fee vs. Rental CCRCs
The exhibit below compares the market performance of entrance fee CCRCs and rental CCRCs by care segment for the second quarter of 2025, highlighting year-over-year changes in occupancy, inventory, and asking rent growth.
Occupancy. Entrance fee CCRCs continued to outpace rental CCRCs in occupancy rate across all care segments. The highest occupancy in entrance fee CCRCs was seen in the independent living segment (93.5%), while memory care segment (91.4%) has the highest occupancy rate in rental CCRCs.
The difference in the second quarter 2025 occupancy rates between entrance fee CCRCs and rental CCRCs was largest in the independent living segment (2.4pps), followed by nursing care segment (1.3pps), and assisted living segment (0.6pps), with the smallest gap in the memory care segment (0.4pps).
Rental CCRCs showed higher year-over-year occupancy growth in independent living (2.1pps), assisted living (3.0pps), and memory care (2.9pps) segments. This is a pattern that has been consistent in recent quarters.
Asking Rent. The monthly average asking rent for entrance fee CCRCs across all care segments remained higher than rental CCRCs. While the actual rent figures were higher for entrance fee CCRCs, the rent growth was higher within the rental CCRCs. Rental CCRCs showed higher year-over-year rent growth in assisted living (4.3% to $6,360), memory care (4.1% to $8,132), and nursing care (4.7% to $407*) segments. Note, these figures are for asking rates and do not consider any discount that may occur.
Inventory. Compared to the year-earlier level, rental CCRCs experienced inventory decline across all care segments. The largest decrease occurred in the assisted living segment (-2.6%), followed by independent living segment (-2.5%), and nursing care segment (-2.1%), with the memory care segment (-1.1%) seeing the smallest decline.
In contrast, entrance fee CCRCs showed mixed trends: assisted living saw the largest year-over-year inventory growth (1.4%), while nursing care inventory experienced the largest decline (-1.0%).
Negative inventory growth can occur when units/beds are temporarily or permanently taken offline or converted to another care segment, outweighing added inventory. This attrition of units, coupled with record-low development activity in the sector, has delivered this trend of an overall decline in inventory.
Look for future articles from NIC to delve into the performance of CCRCs.
Studios Still Matter, But Space Is Gaining Traction: What Unit Mix Trends Reveal
In this article, NIC Analytics revisits senior housing unit mix (the proportion of studios, one-bedroom, two-bedroom units, and increasingly, even three-bedroom or larger units), and occupancy trends across independent living (IL) and assisted living (AL) properties using data from the second quarter of 2025. The analysis offers a current snapshot of how unit sizes are distributed, how they are performing, what has changed over the last decade, and what is taking place with new senior housing developments coming on the market today.
Key Takeaways:
While unit mix has not changed much across the last decade, rising occupancy in larger units, especially in assisted living, signals a shift in preferences among segments of the demand base.
Developers are responding to these changing preferences, with more two- and three- bedroom units entering the pipeline.
A successful unit mix balances care needs with new lifestyle expectations and shared living potential.
Current Unit Mix: Studios Still Dominate Assisted Living, But Independent Living Sees Size Diversity
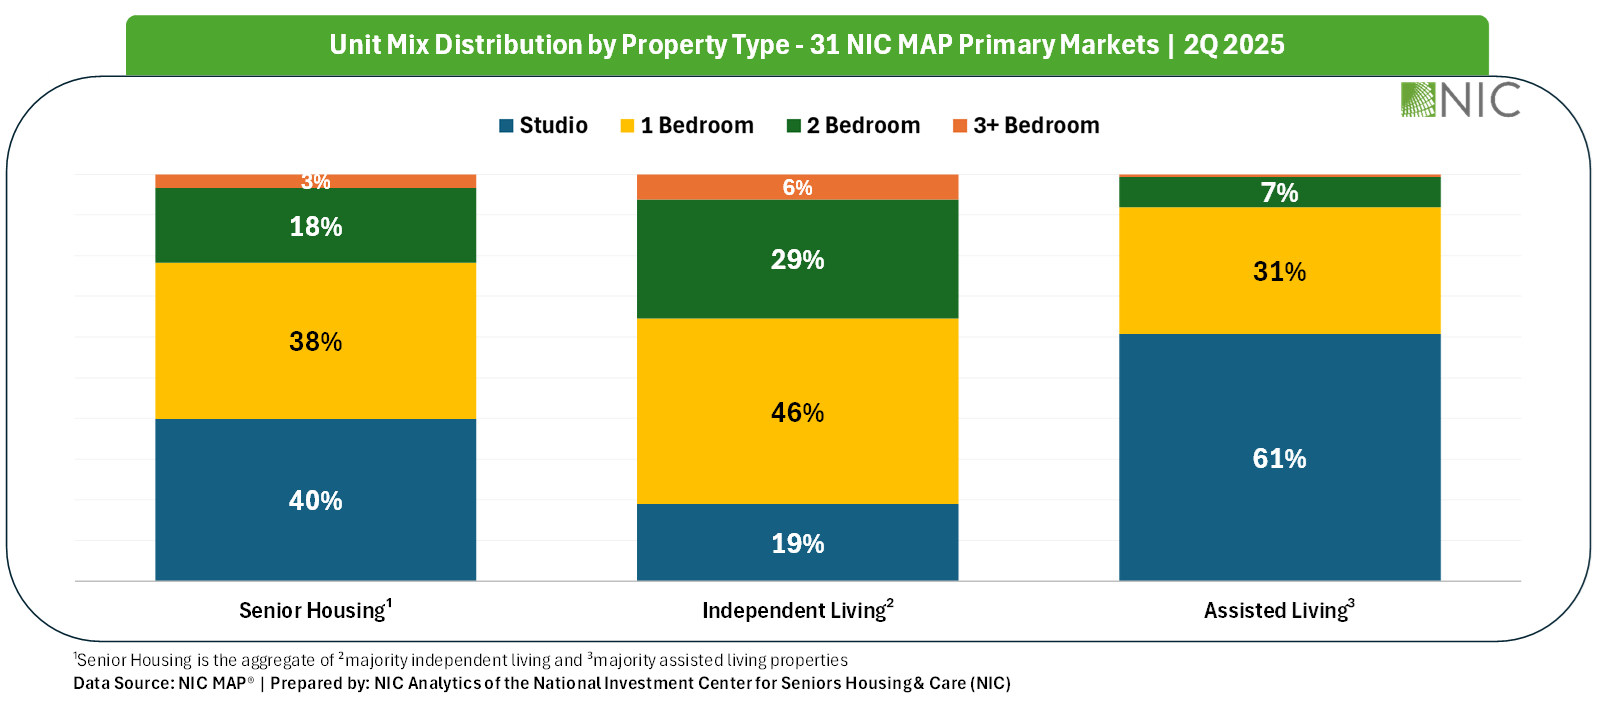
Across all senior housing properties (IL + AL combined), studios make up the largest share of the unit mix at 40%, followed closely by one-bedroom units at 38%, and two-bedroom units at 18%, then a small share – just 3% – consists of three-bedroom or larger options.
However, when broken down by property type, important distinctions emerge: Independent living properties skew toward larger units (one- and two-bedrooms) while assisted living properties are heavily weighted toward smaller units (studios).
These differences may reflect the functional and financial needs of residents. Independent living residents often prioritize space, privacy, and lifestyle, while assisted living residents may prioritize affordability and accessibility, especially as care needs increase. Additionally, more couples generally reside in independent living than in assisted living, which generally translates into larger units.
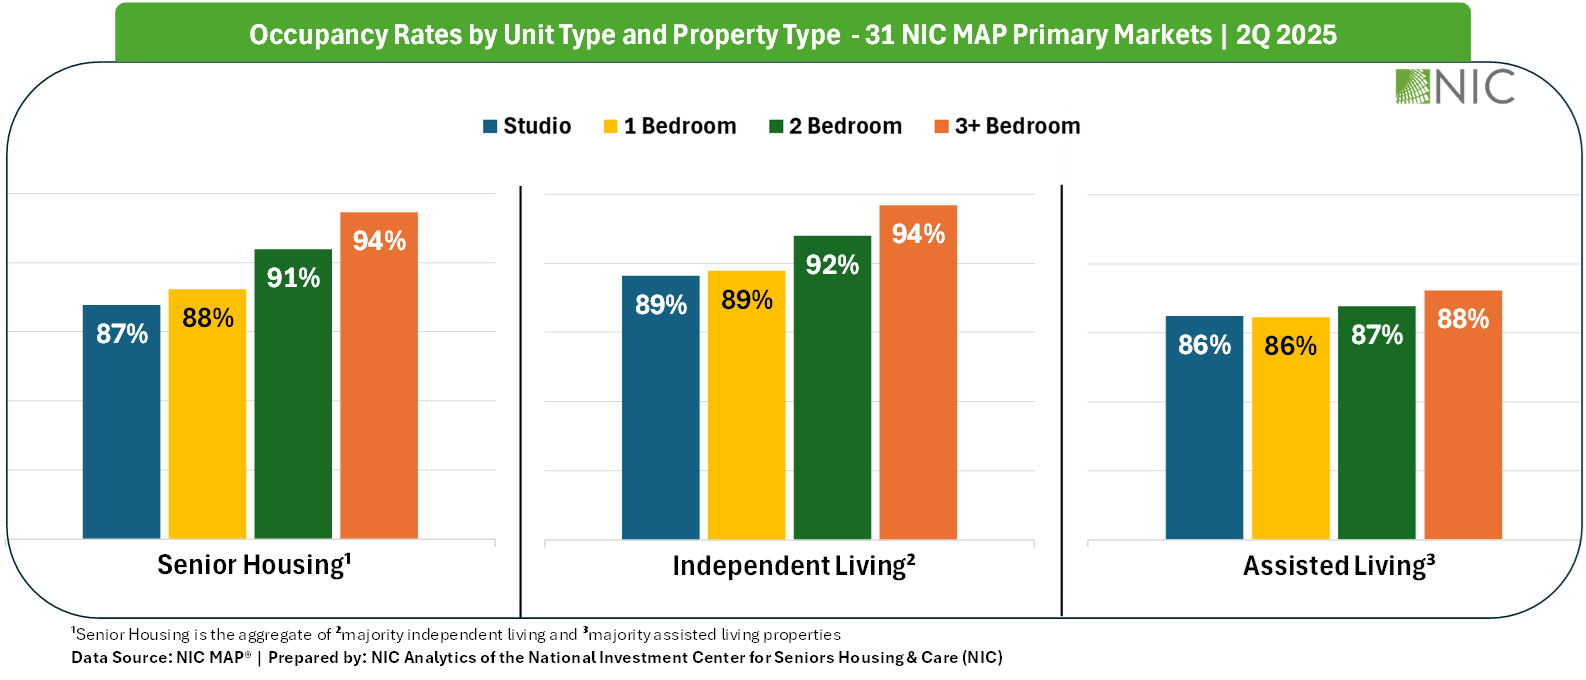
Occupancy by Unit Type: Bigger Units, Higher Occupancy?
Occupancy patterns as of the second quarter of 2025 offer further insights. Larger units are performing better across both property types. While assisted living still maintains relatively high occupancy for studio units, there is now a clear pattern between unit size and occupancy across the board, particularly in independent living. This suggests increasing resident preference for more spacious accommodations, even among residents requiring assistance.
A Look Back: Stability in Mix, But Shifts in Preference
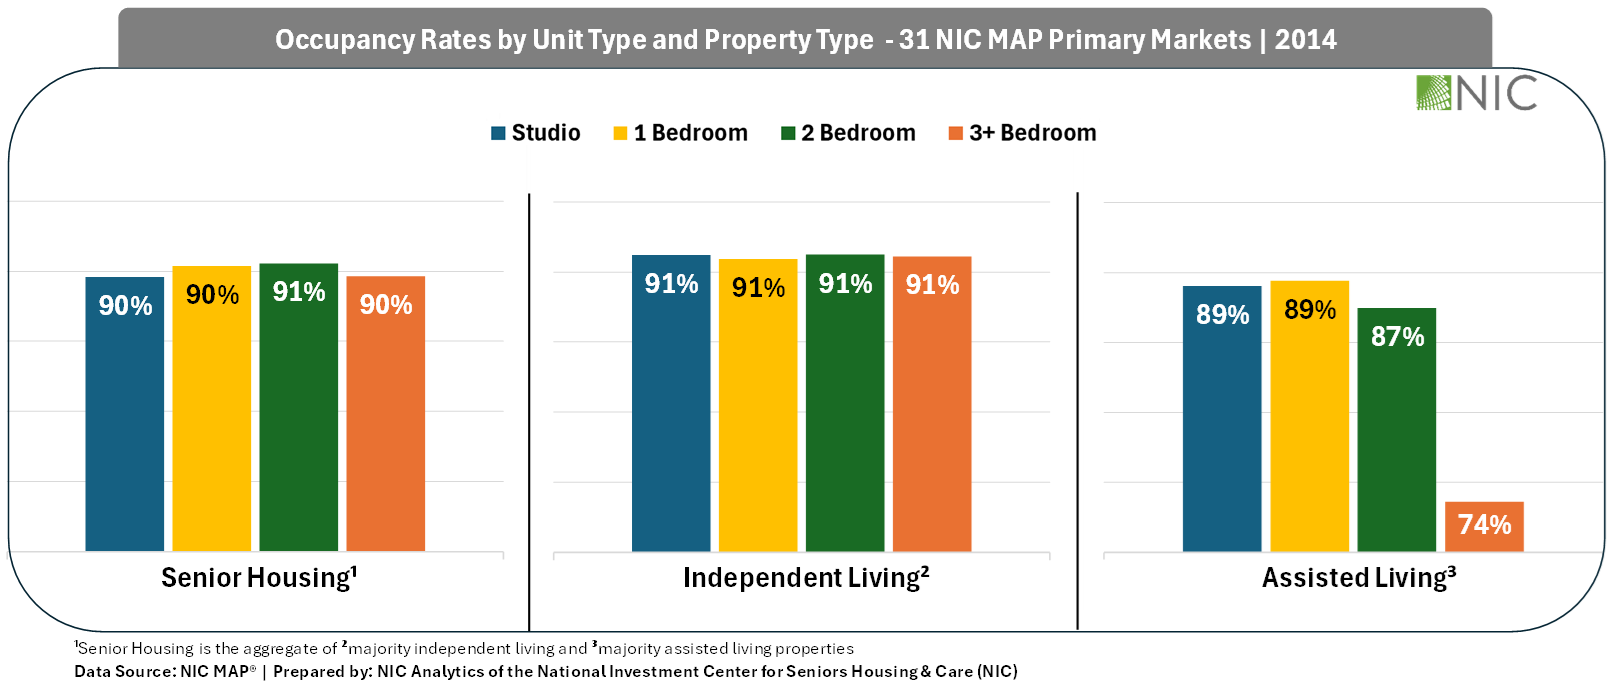
Interestingly, the unit mix distribution has not changed dramatically over the past decade. Studios continued to dominate assisted living, and independent living remained the more diverse offering in terms of size. But what has changed is resident demand for larger units.
A decade ago, occupancy was relatively flat across unit types. The notable exception was 3+ bedroom assisted living units, which hovered in the mid-70% range, suggesting they were mismatched with the needs or preferences of residents at the time. In 2025, however, occupancy for those units is closer to 88%, hinting that preferences in independent living may be bleeding into assisted living as residents transition through the continuum of care.
This trend may reflect a generational shift in expectations, or perhaps a cohort of residents entering assisted living with greater financial means or stronger lifestyle preferences for space, privacy, and comfort.
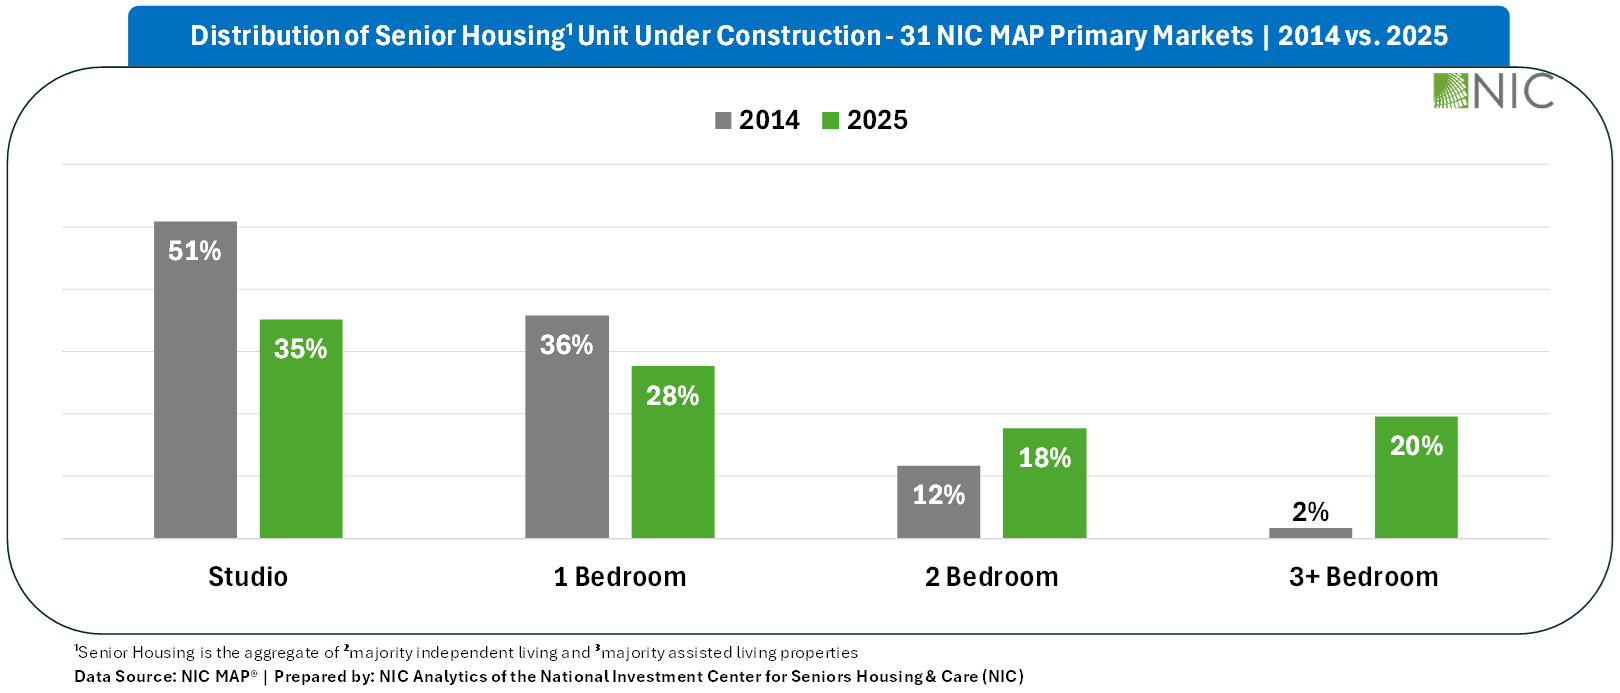
Senior Housing Development Trends Confirm the Shift
The changing preferences in unit mix are not just showing up in occupancy, they are also reflected in what is being built. A decade ago, studios made up over half (51%) of all senior housing units under construction. In 2025, that share has dropped to 35%, while construction of larger units has materially increased. Notably, two-bedroom or larger units, once just 14% of new development, now account for 38% of new units coming onto the market. This shift suggests that developers are responding to the changing preferences among segments of the demand base.
In conclusion, market factors such as location, demographics, and income profiles all influence unit mix decisions, along with the vision of the owner or operator. While studios remain essential, particularly in assisted living, where affordability and accessibility are key, larger units are increasingly demonstrating stronger occupancy performance and emerging as a high-performing niche.
Looking ahead, larger units may gain further traction among middle-income residents seeking shared living arrangements that lower costs while enhancing efficiency and social connection. Conversely, there may be opportunities to market the less desirable studios to a middle-income senior through strategic market positioning. As the aging population continues to transform, the most successful properties will be those that align care needs with lifestyle aspirations, designing unit mixes that reflect not only acuity, but also the changing values and expectations of the next generation of residents.
Note this analysis only includes properties reporting the unit mixes within the senior housing properties. This means that properties with unknown unit mixes were excluded from the analysis.
Senior Housing Posts Highest NCREIF Property Type Return in the First Half of 2025
Senior housing posted a positive total return of 2.08% in the second quarter of 2025, bringing year-to-date returns to 4.00%, the highest NCREIF property type return for the first half of the year.
Senior housing in the second quarter outperformed the broader Expanded NCREIF Property Index (NPI) by 85 basis points, with the index posting a total return of 1.23%. Senior housing capital appreciation in the second quarter was positive with valuations increasing 0.72%. The capital appreciation return is the change in value net of any capital expenditures incurred during the quarter. Senior housing income return in the second quarter was also positive, yielding 1.36%. For the broader NPI in the second quarter, both capital appreciation (+0.04%) and income yield (+1.19%) were also positive.
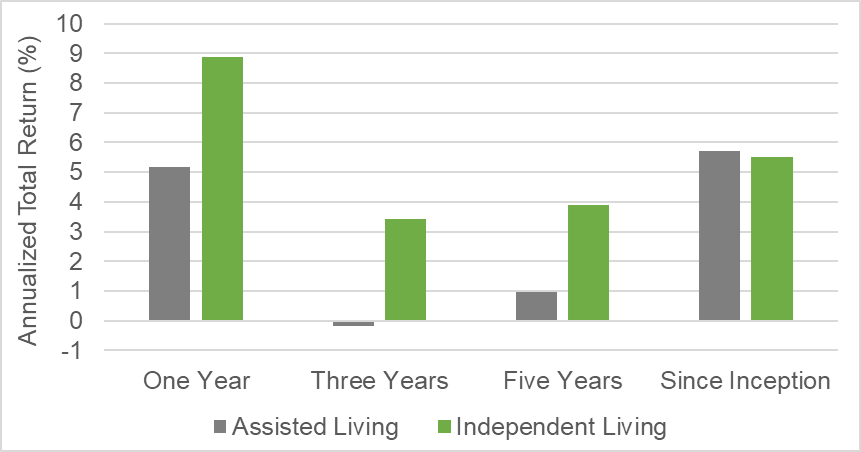
By senior housing property subtype, independent living (+2.15%) outperformed assisted living (+1.99%) in the second quarter. In recent years, independent living has also outperformed assisted living over the one-, three-, and five-year periods. This outperformance may be driven by higher margins typically generated in lower acuity settings such as independent living, which require less staffing and labor expenses than higher acuity settings such as assisted living. Additionally, independent living has had higher occupancy rates during this period. Over the longer run, since NCREIF began tracking returns data for these subtypes roughly a decade ago, both assisted living and independent living posted similar returns averaging more than 5.5% annually.
Annualized Total Returns by NCREIF Property Subtype As of 6/30/2025; Unlevered
Note: Since Inception is 2014 for Assisted Living and 2016 for Independent Living
Source: NCREIF, 2Q 2025, Unlevered Annualized Total Returns
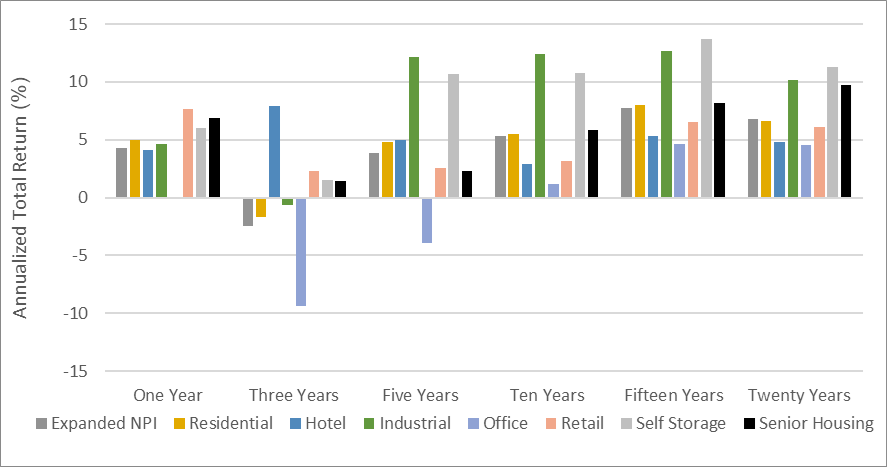
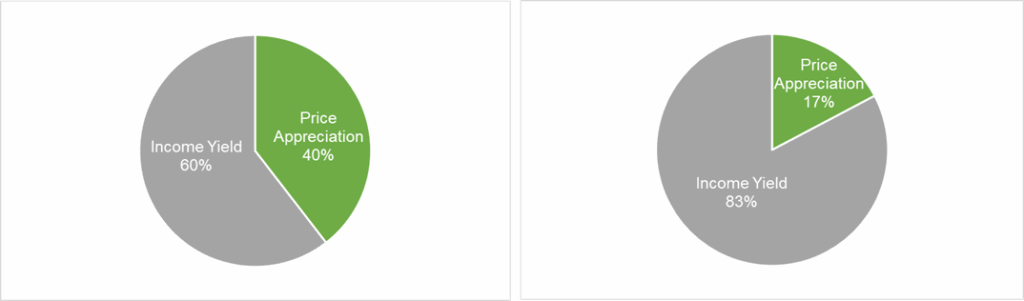
Compared to other NCREIF property types over the 10-, 15-, and 20-year periods, senior housing was the strongest property type except for industrial and self-storage, outperforming the NPI on an annualized basis by 52, 41, and 297 basis points, respectively. Since the 2003 inception of NCREIF’s senior housing historical series, income yield drove roughly 60% of senior housing total returns, while price appreciation contributed roughly 40%. These performance measures reflect the returns of 211 senior housing properties valued at $12.38 billion in the second quarter. Overall, the number of senior housing properties tracked within the NPI has grown significantly from the 56 properties initially tracked in 2003.
Annualized Total Returns by NCREIF Property Type As of 6/30/2025; Unlevered
Source: NCREIF, 2Q 2025, Unlevered Annualized Total Returns
Senior Housing Total Returns by Income Yield versus Price Appreciation As of 6/30/2025; Unlevered
Since Inception (2Q 2003)
10-Year (2Q 2015)
Source: NCREIF, 2Q 2025, Unlevered Annualized Total Returns
Senior housing market fundamentals remained positive in the second quarter, with the occupancy rate for the 31 NIC MAP Primary Markets increasing 0.8 percentage points to 88.1%, driven by net absorption of senior housing units outpacing the number of new units arriving online. Occupied units reached another record high in the second quarter, while year-over-year inventory growth fell below 1.0% for the first time since NIC MAP began tracking this data in 2006. By property type, occupancy rates for independent living have made slightly higher gains in recent quarters than assisted living, which is a reversal of trends in 2022 and 2023. In the second quarter, independent living increased to an average occupancy rate of 89.7%, while assisted living increased to 86.4%.
TOTAL RETURN
NCREIF Property Index (NPI)
Senior Housing
Assisted Living
Independent Living
2Q 2025
1.23
2.08
1.99
2.15
YTD
2.51
4.00
3.27
4.79
One Year
4.31
6.91
5.17
8.87
Three Years
-2.49
1.44
-0.19
3.41
Five Years
3.83
2.29
0.98
3.89
Ten Years
5.31
5.83
5.28
N/A
Fifteen Years
7.77
8.18
N/A
N/A
Twenty Years
6.78
9.75
N/A
N/A
INCOME
NCREIF Property Index (NPI)
Senior Housing
Assisted Living
Independent Living
2Q 2025
1.19
1.36
1.39
1.34
YTD
2.38
2.72
2.74
2.72
One Year
4.81
5.26
5.11
5.45
Three Years
4.47
4.47
4.05
4.99
Five Years
4.35
4.06
3.63
4.59
Ten Years
4.51
4.79
4.63
N/A
Fifteen Years
4.94
5.50
N/A
N/A
Twenty Years
5.20
5.96
N/A
N/A
APPRECIATION
NCREIF Property Index (NPI)
Senior Housing
Assisted Living
Independent Living
2Q 2025
0.04
0.72
0.59
0.81
YTD
0.13
1.26
0.52
2.04
One Year
-0.48
1.59
0.07
3.28
Three Years
-6.73
-2.93
-4.11
-1.52
Five Years
-0.51
-1.71
-2.58
-0.68
Ten Years
0.77
1.00
0.63
N/A
Fifteen Years
2.74
2.59
N/A
N/A
Twenty Years
1.53
3.65
N/A
N/A
Source: NCREIF, 2Q 2025, Unlevered Annualized Total Returns
We use cookies on our website to give you the most relevant experience by remembering your preferences and repeat visits. NIC's privacy policy can be viewed here. By clicking “Accept”, you consent to the use of ALL the cookies.
This website uses cookies to improve your experience while you navigate through the website. Out of these cookies, the cookies that are categorized as necessary are stored on your browser as they are essential for the working of basic functionalities of the website. We also use third-party cookies that help us analyze and understand how you use this website. These cookies will be stored in your browser only with your consent. You also have the option to opt-out of these cookies. But opting out of some of these cookies may have an effect on your browsing experience.
Necessary cookies are absolutely essential for the website to function properly. This category only includes cookies that ensures basic functionalities and security features of the website. These cookies do not store any personal information.
Functional cookies help to perform certain functionalities like sharing the content of the website on social media platforms, collect feedbacks, and other third-party features.
Performance cookies are used to understand and analyze the key performance indexes of the website which helps in delivering a better user experience for the visitors.
Analytical cookies are used to understand how visitors interact with the website. These cookies help provide information on metrics the number of visitors, bounce rate, traffic source, etc.
Advertisement cookies are used to provide visitors with relevant ads and marketing campaigns. These cookies track visitors across websites and collect information to provide customized ads.