Senior housing strongly outperformed all NCREIF property types in 2025, posting a 10.6% total return, more than double the Expanded NCREIF Property Index (NPI) total return of 4.9% and well ahead of the second highest return of 6.8% for retail properties.
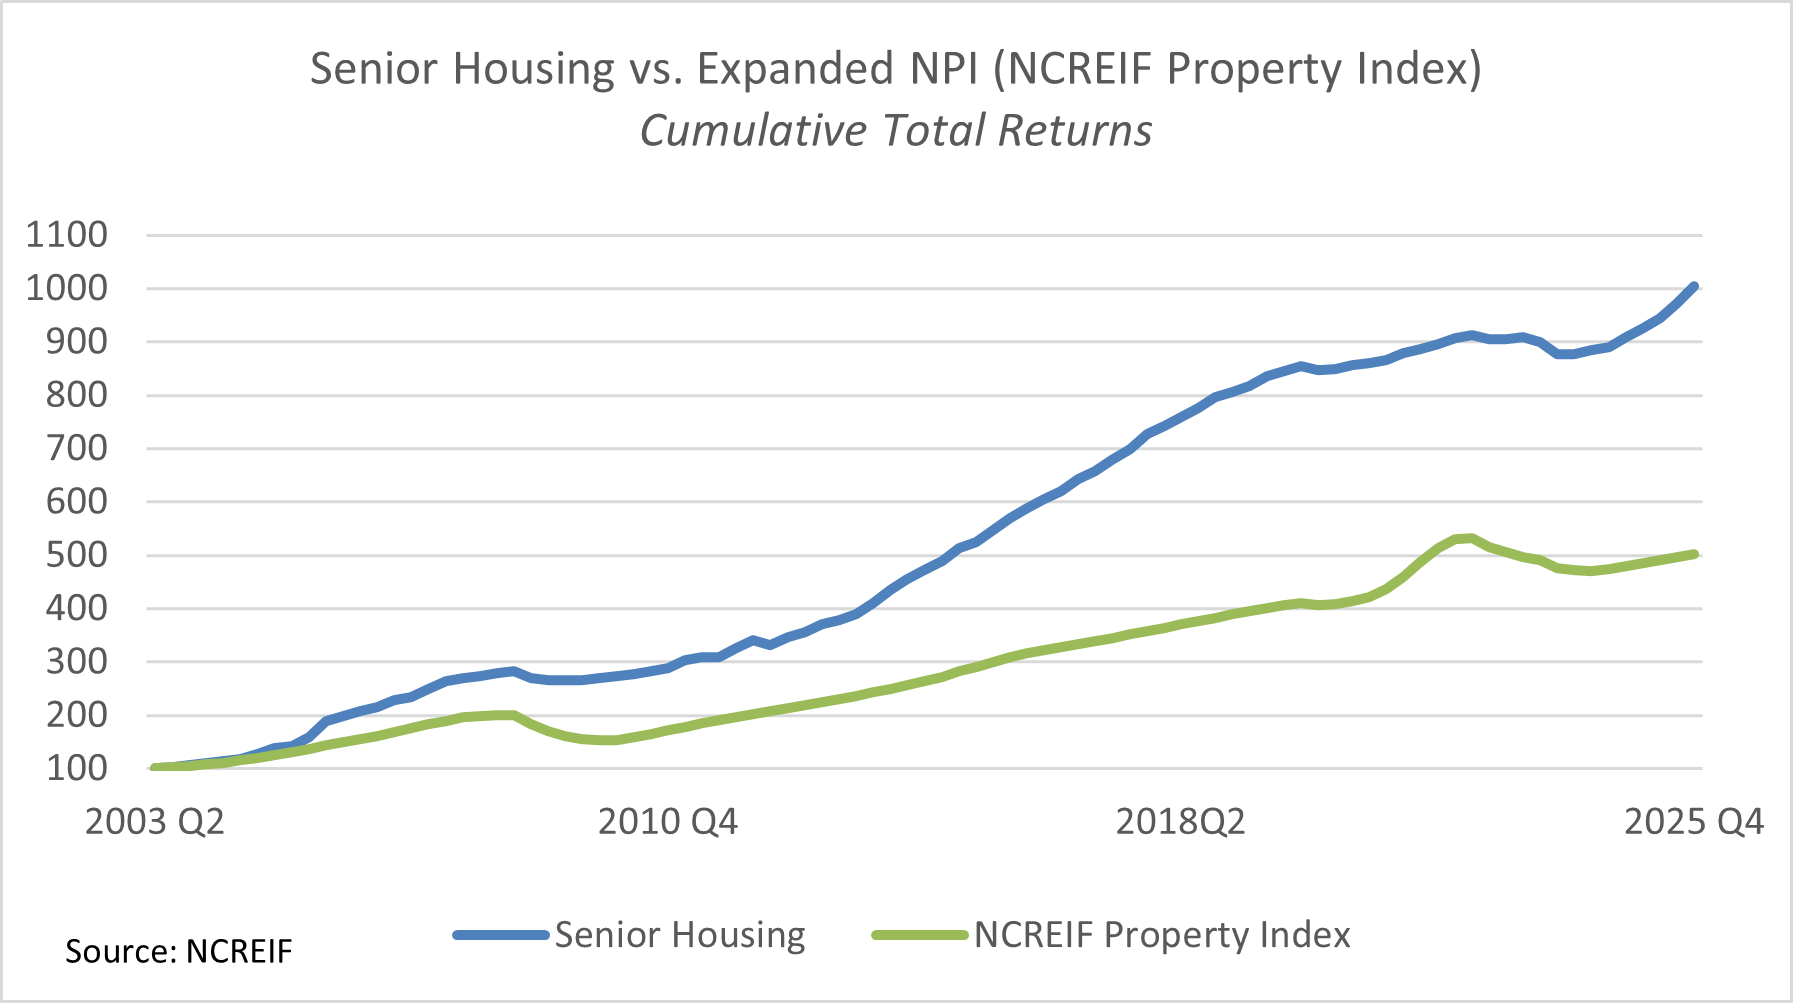
For the most recent quarter alone, senior housing posted a total return of 3.3%, outperforming the broader NPI total return of 1.1% by 220 basis points.

Source: NCREIF
Senior housing capital appreciation in the fourth quarter was 2.0%, the highest quarterly gain since 2017. The capital appreciation return is the change in value net of any capital expenditures incurred during the quarter. Senior housing income return in the fourth quarter was also positive, yielding 1.4%.
These performance measures reflect the returns of 219 senior housing properties valued at $13.6 billion in the fourth quarter. Overall, the number of senior housing properties tracked within the NPI has grown significantly from the 56 properties initially tracked in 2003, a reflection of increased institutional investment in the property type.
Annualized Total Returns by NCREIF Property Type

As of 12/31/2025; Unlevered
By senior housing property subtype in the fourth quarter, assisted living (+3.7%) outperformed independent living (+2.8%) on a total return basis, which was a reversal of recent trends, and was driven by both higher income yield and higher capital appreciation in assisted living properties. For the full year 2025, however, independent living continued to outperform assisted living with a total return of 11.1% versus 10.0%, respectively.
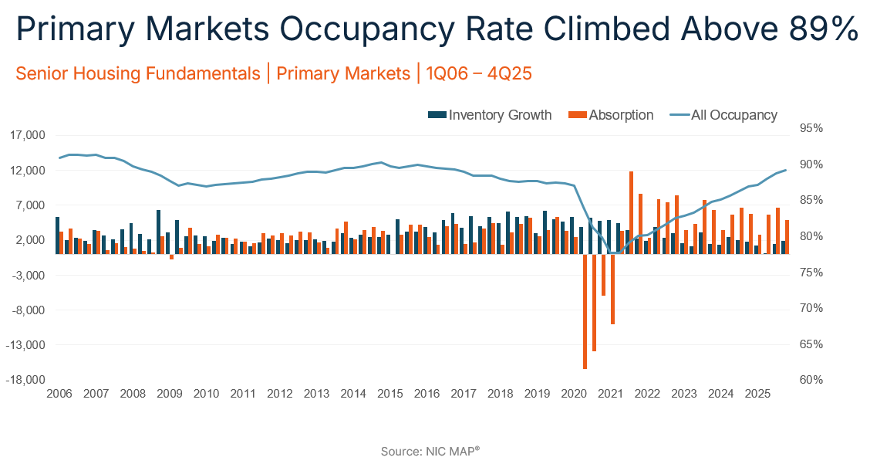
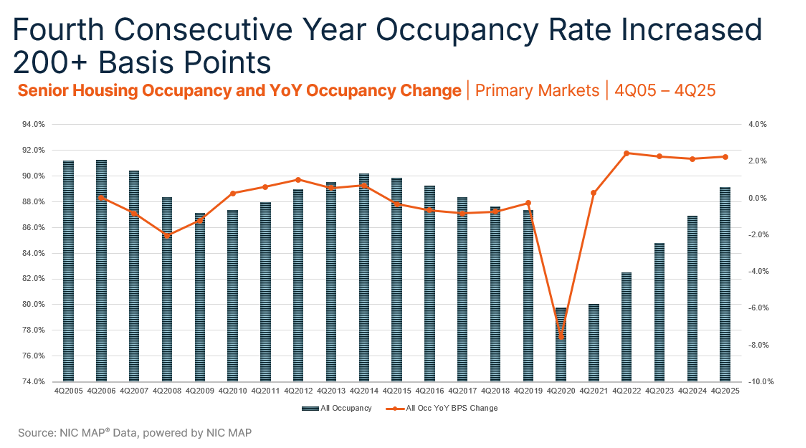
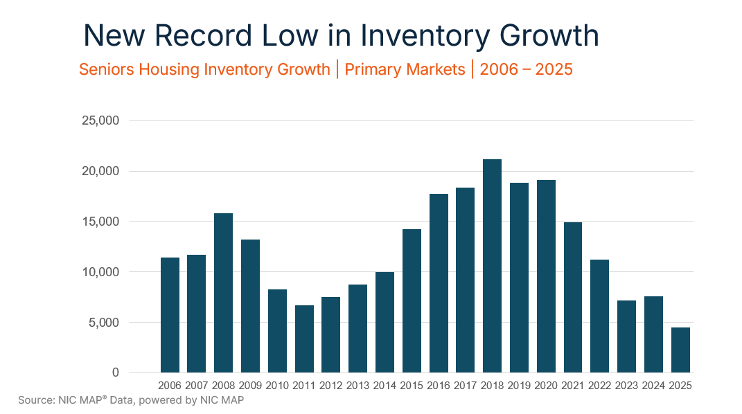
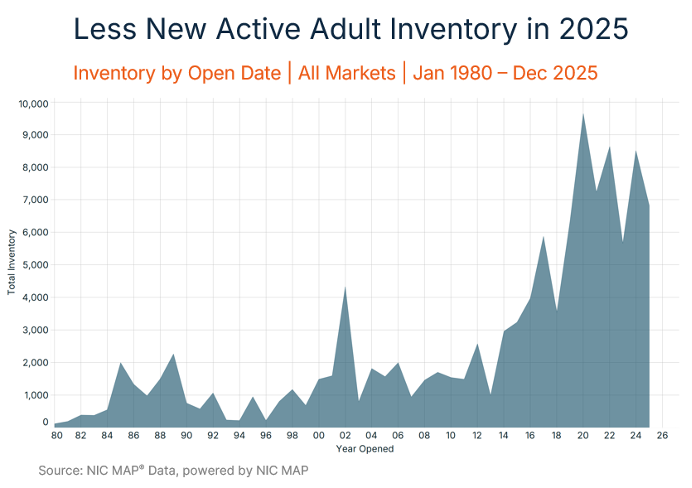
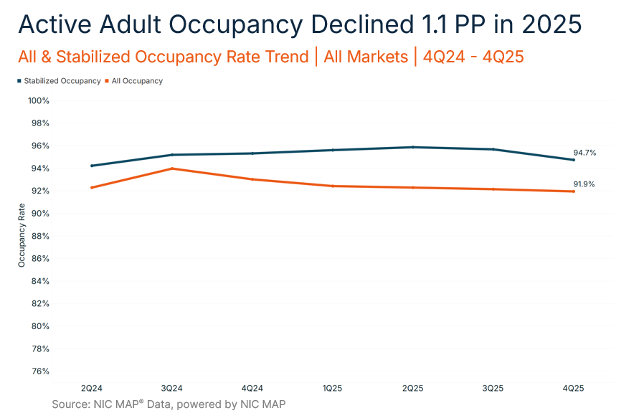
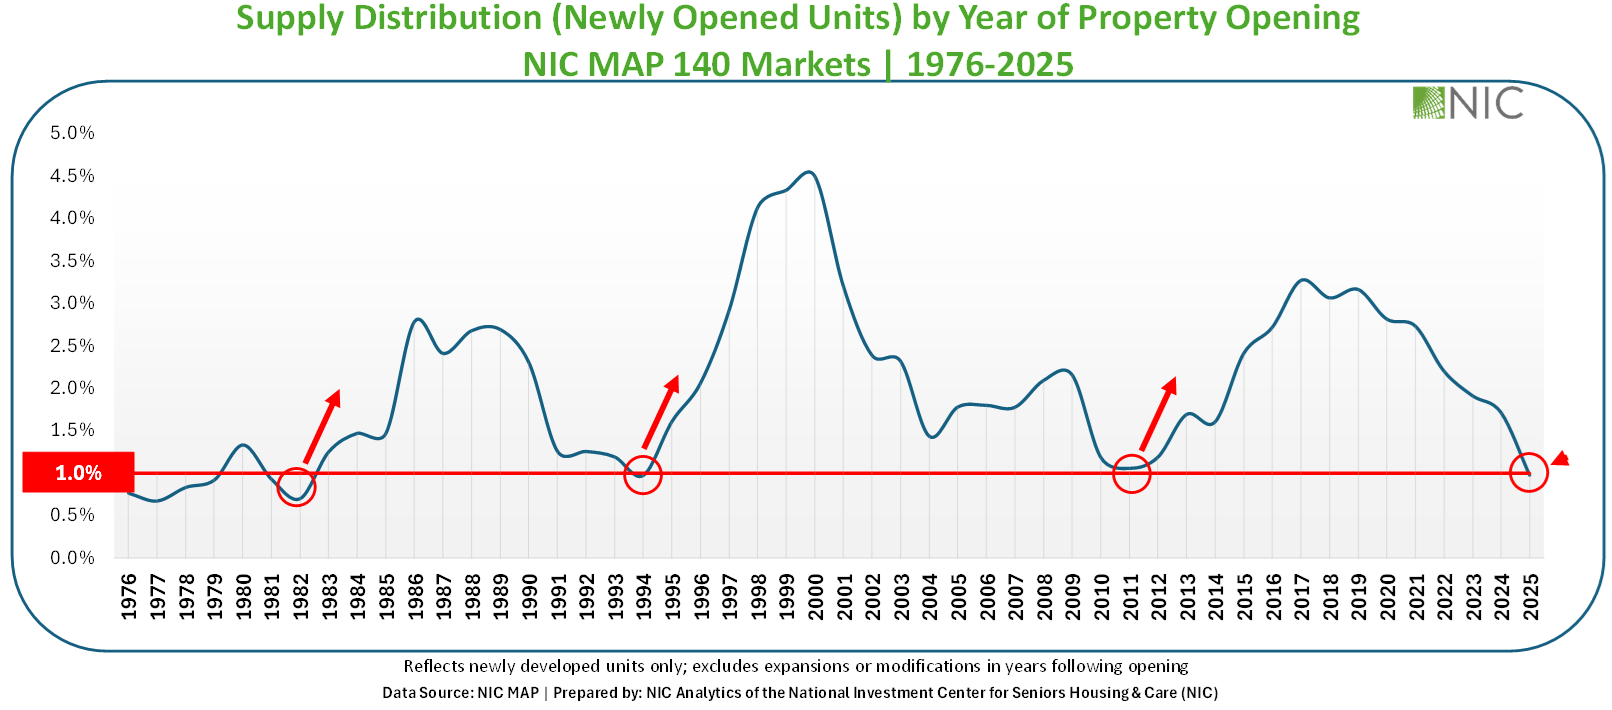
Turning to market fundamentals, a fourth consecutive year of strong net absorption coupled with record low inventory growth propelled senior housing occupancy rates to 89.1%. Looking ahead, new supply is expected to remain moderate in the near term as the number of units under construction has fallen to levels last seen in 2012. With demand outpacing new supply, occupancy rates are on track to surpass 90% in 2026.
| TOTAL RETURN | ||||
| NCREIF Property Index (NPI) | Senior Housing | Assisted Living | Independent Living | |
| 4Q 2025 | 1.14 | 3.34 | 3.72 | 2.85 |
| YTD | 4.94 | 10.57 | 9.96 | 11.12 |
| One Year | 4.94 | 10.57 | 9.96 | 11.12 |
| Three Years | -0.84 | 3.62 | 2.17 | 5.34 |
| Five Years | 3.90 | 3.36 | 2.20 | 4.75 |
| Ten Years | 4.94 | 5.74 | 5.22 | N/A |
| Fifteen Years | 7.34 | 8.37 | N/A | N/A |
| Twenty Years | 6.39 | 8.51 | N/A | N/A |
| INCOME | ||||
| NCREIF Property Index (NPI) | Senior Housing | Assisted Living | Independent Living | |
| 4Q 2025 | 1.15 | 1.37 | 1.44 | 1.29 |
| YTD | 4.76 | 5.57 | 5.71 | 5.44 |
| One Year | 4.76 | 5.57 | 5.71 | 5.44 |
| Three Years | 4.61 | 4.82 | 4.55 | 5.16 |
| Five Years | 4.41 | 4.24 | 3.86 | 4.72 |
| Ten Years | 4.50 | 4.80 | 4.61 | N/A |
| Fifteen Years | 4.87 | 5.43 | N/A | N/A |
| Twenty Years | 5.15 | 5.86 | N/A | N/A |
| APPRECIATION | ||||
| NCREIF Property Index (NPI) | Senior Housing | Assisted Living | Independent Living | |
| 4Q 2025 | -0.01 | 1.98 | 2.28 | 1.56 |
| YTD | 0.18 | 4.81 | 4.07 | 5.47 |
| One Year | 0.18 | 4.81 | 4.07 | 5.47 |
| Three Years | -5.26 | -1.15 | -2.29 | 0.17 |
| Five Years | -0.49 | -0.84 | -1.60 | 0.03 |
| Ten Years | 0.43 | 0.92 | 0.60 | N/A |
| Fifteen Years | 2.39 | 2.83 | N/A | N/A |
| Twenty Years | 1.19 | 2.54 | N/A | N/A |
| Source: NCREIF, 4Q 2025, Unlevered Annualized Total Returns | ||||