Growth is no longer a future ambition for senior housing operators. It is a present-day imperative. But in a market shaped by rising demand, constrained supply, evolving consumer expectations, and more selective capital, growth for growth’s sake is not enough. The operators best positioned for what comes next are those scaling with intention: strengthening their teams, protecting their culture, sharpening their story, investing in systems, and building the right partnerships before opportunity outpaces readiness.
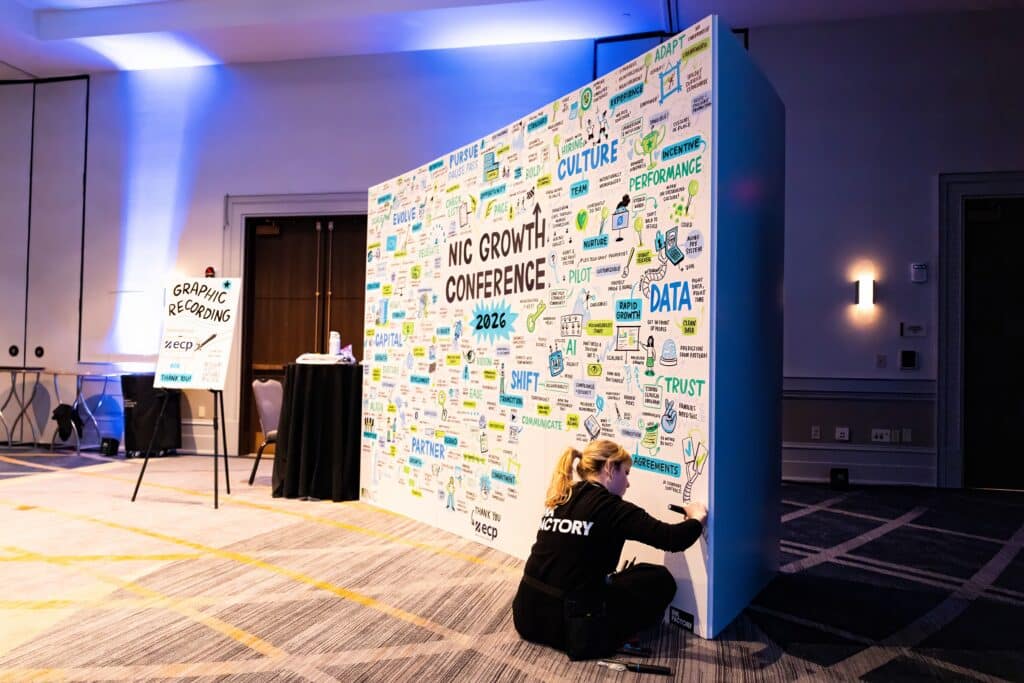
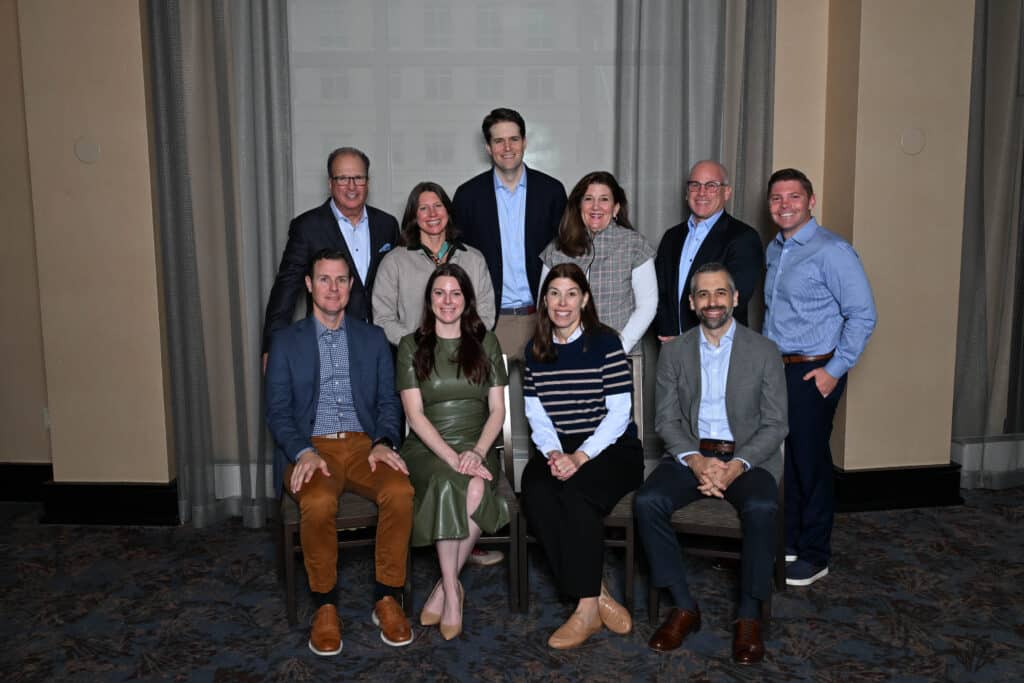
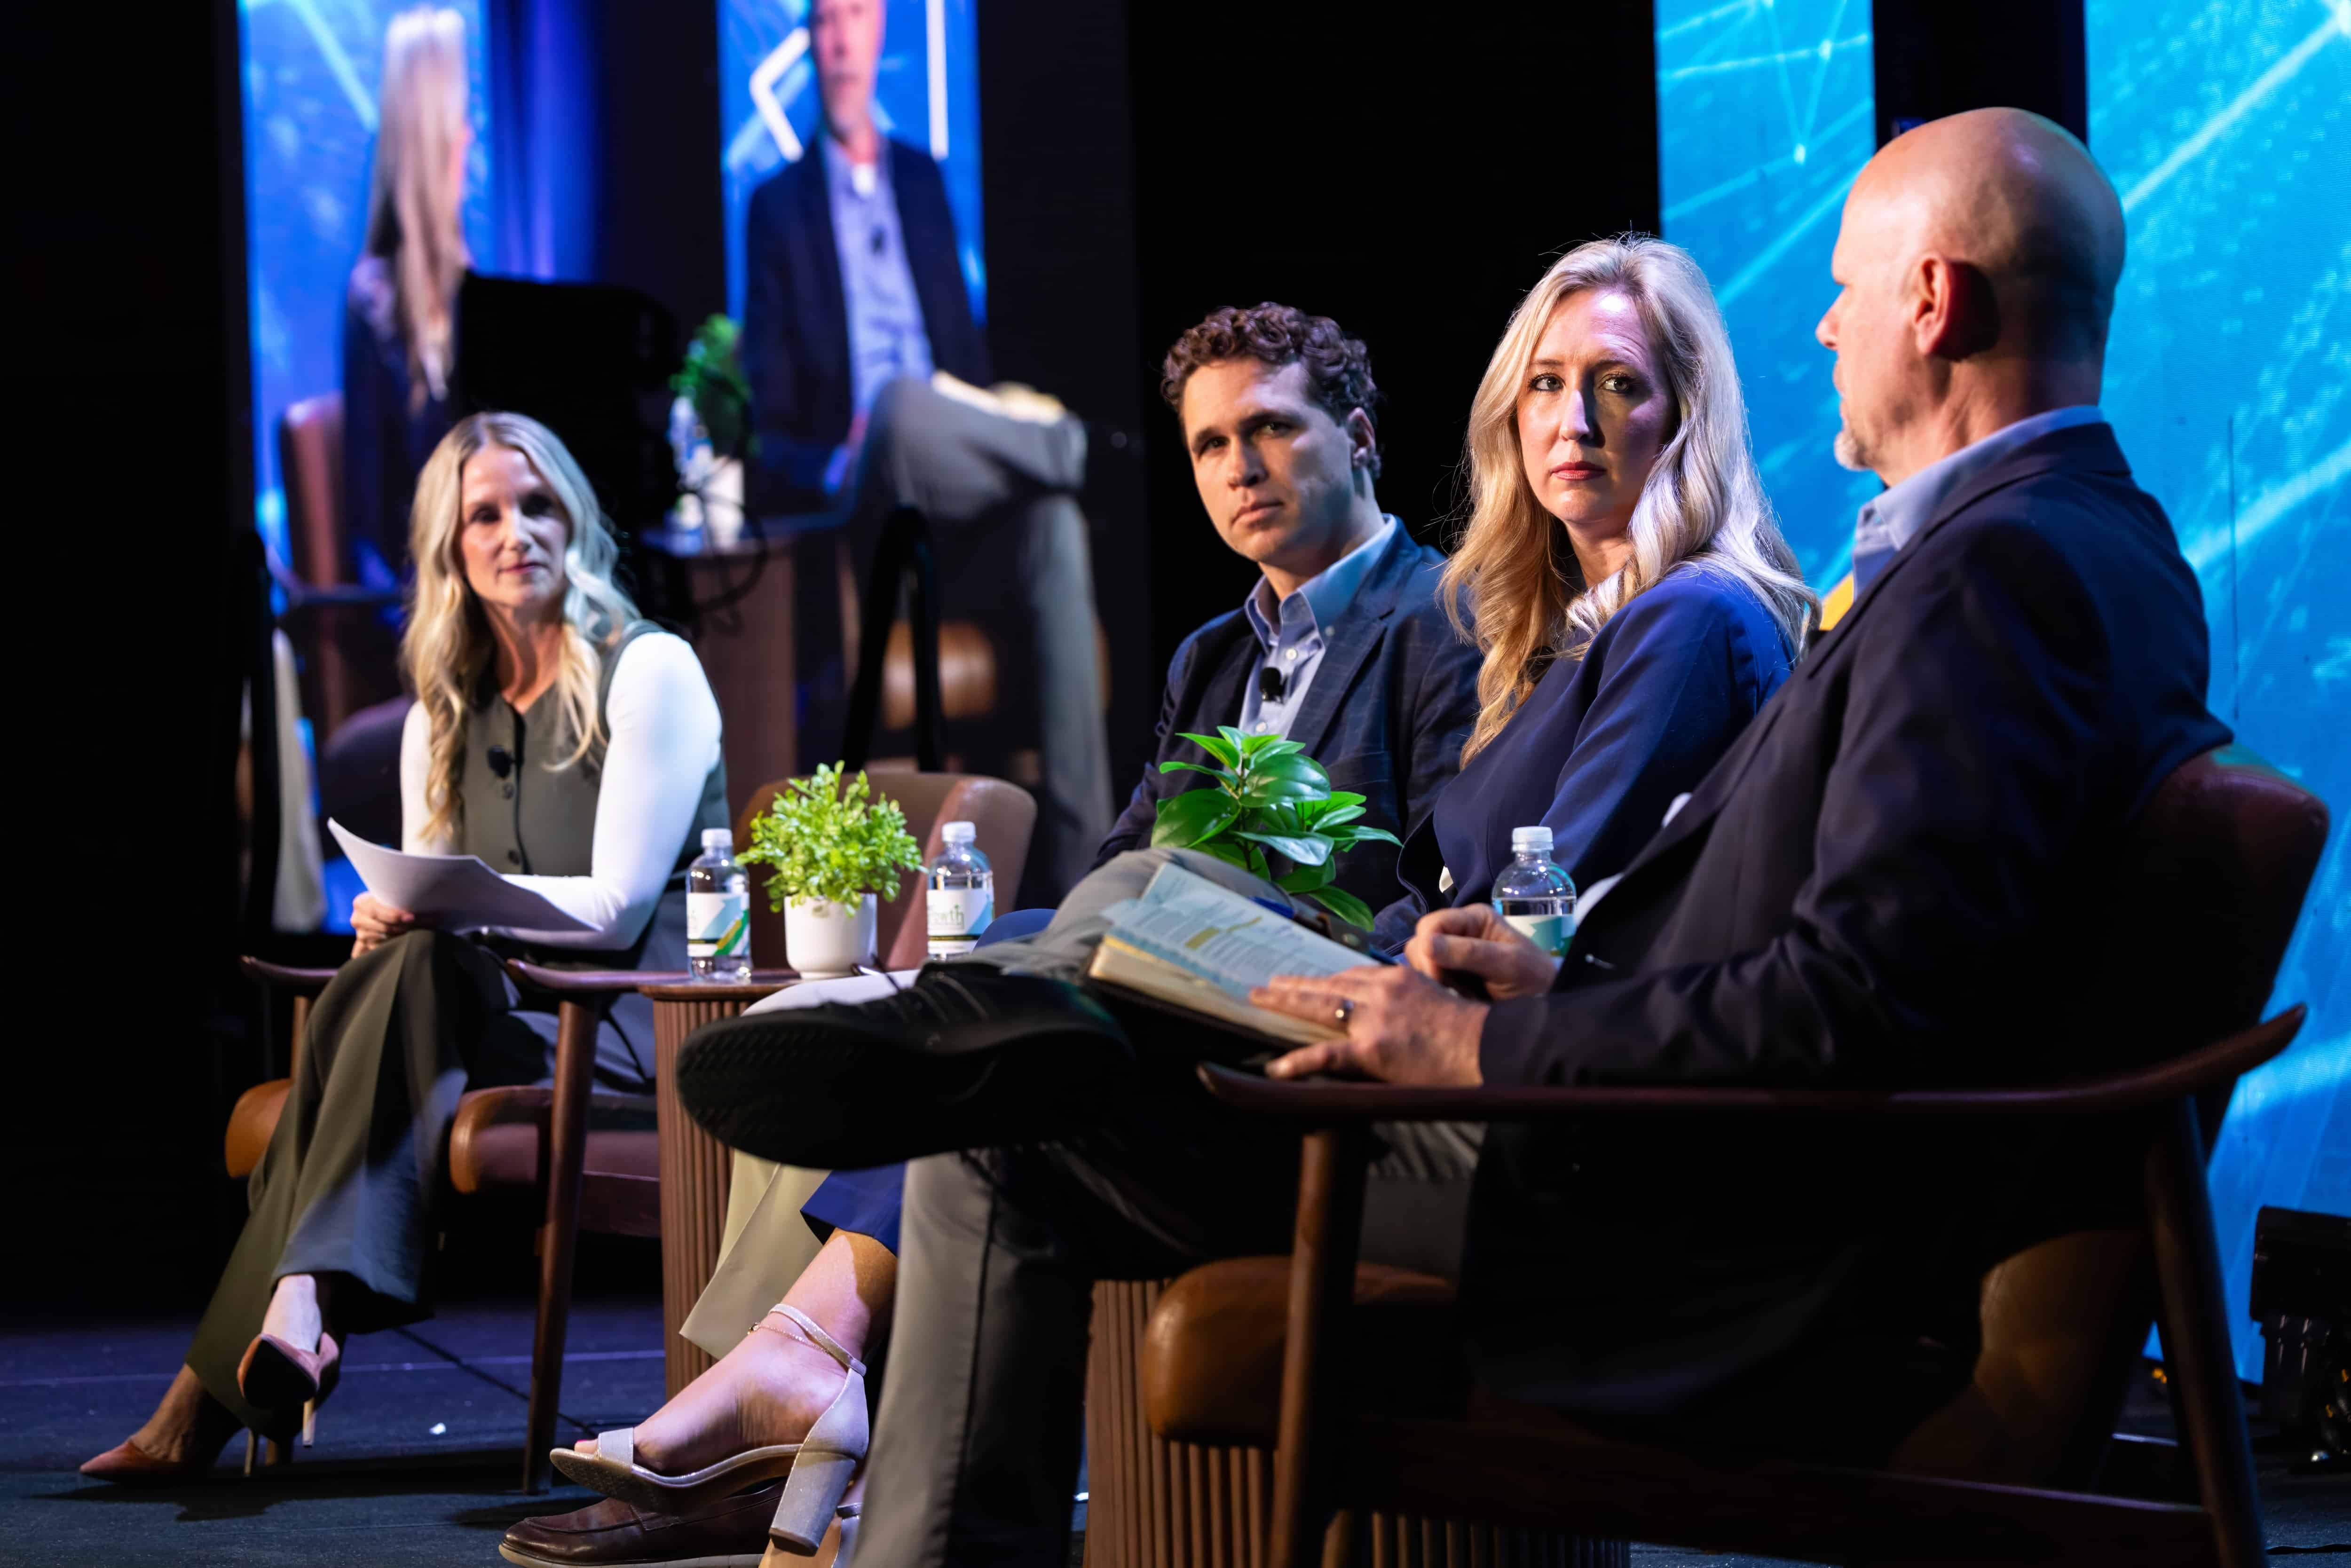
That is where the National Investment Center for Seniors Housing & Care (NIC) plays a critical role. On May 13–14, NIC hosted its annual Growth Conference, bringing more than 300 senior housing and care leaders to Indianapolis for two days focused on scaling with discipline and intention. Purpose-built for small to mid-size operators, capital providers, and strategic partners, the conference offered practical strategies, firsthand lessons from experienced leaders, and high-value connections to help organizations prepare for their next stage of growth.
The conference brought together operators looking for practical growth strategies, capital providers seeking strong operating partners, vendors and strategic partners supporting the sector’s evolution, and experienced leaders willing to share what has worked, what has not, and what they would do differently.
As Sevy Petras, Co-Founder and CEO of Priority Life Care, and Growth Conference Program Committee Co-Chair noted in opening remarks, “What operators need right now isn’t more theory, it’s what’s actually working.”
That idea carried through every session.
Growth Requires Discipline, Not Just Opportunity
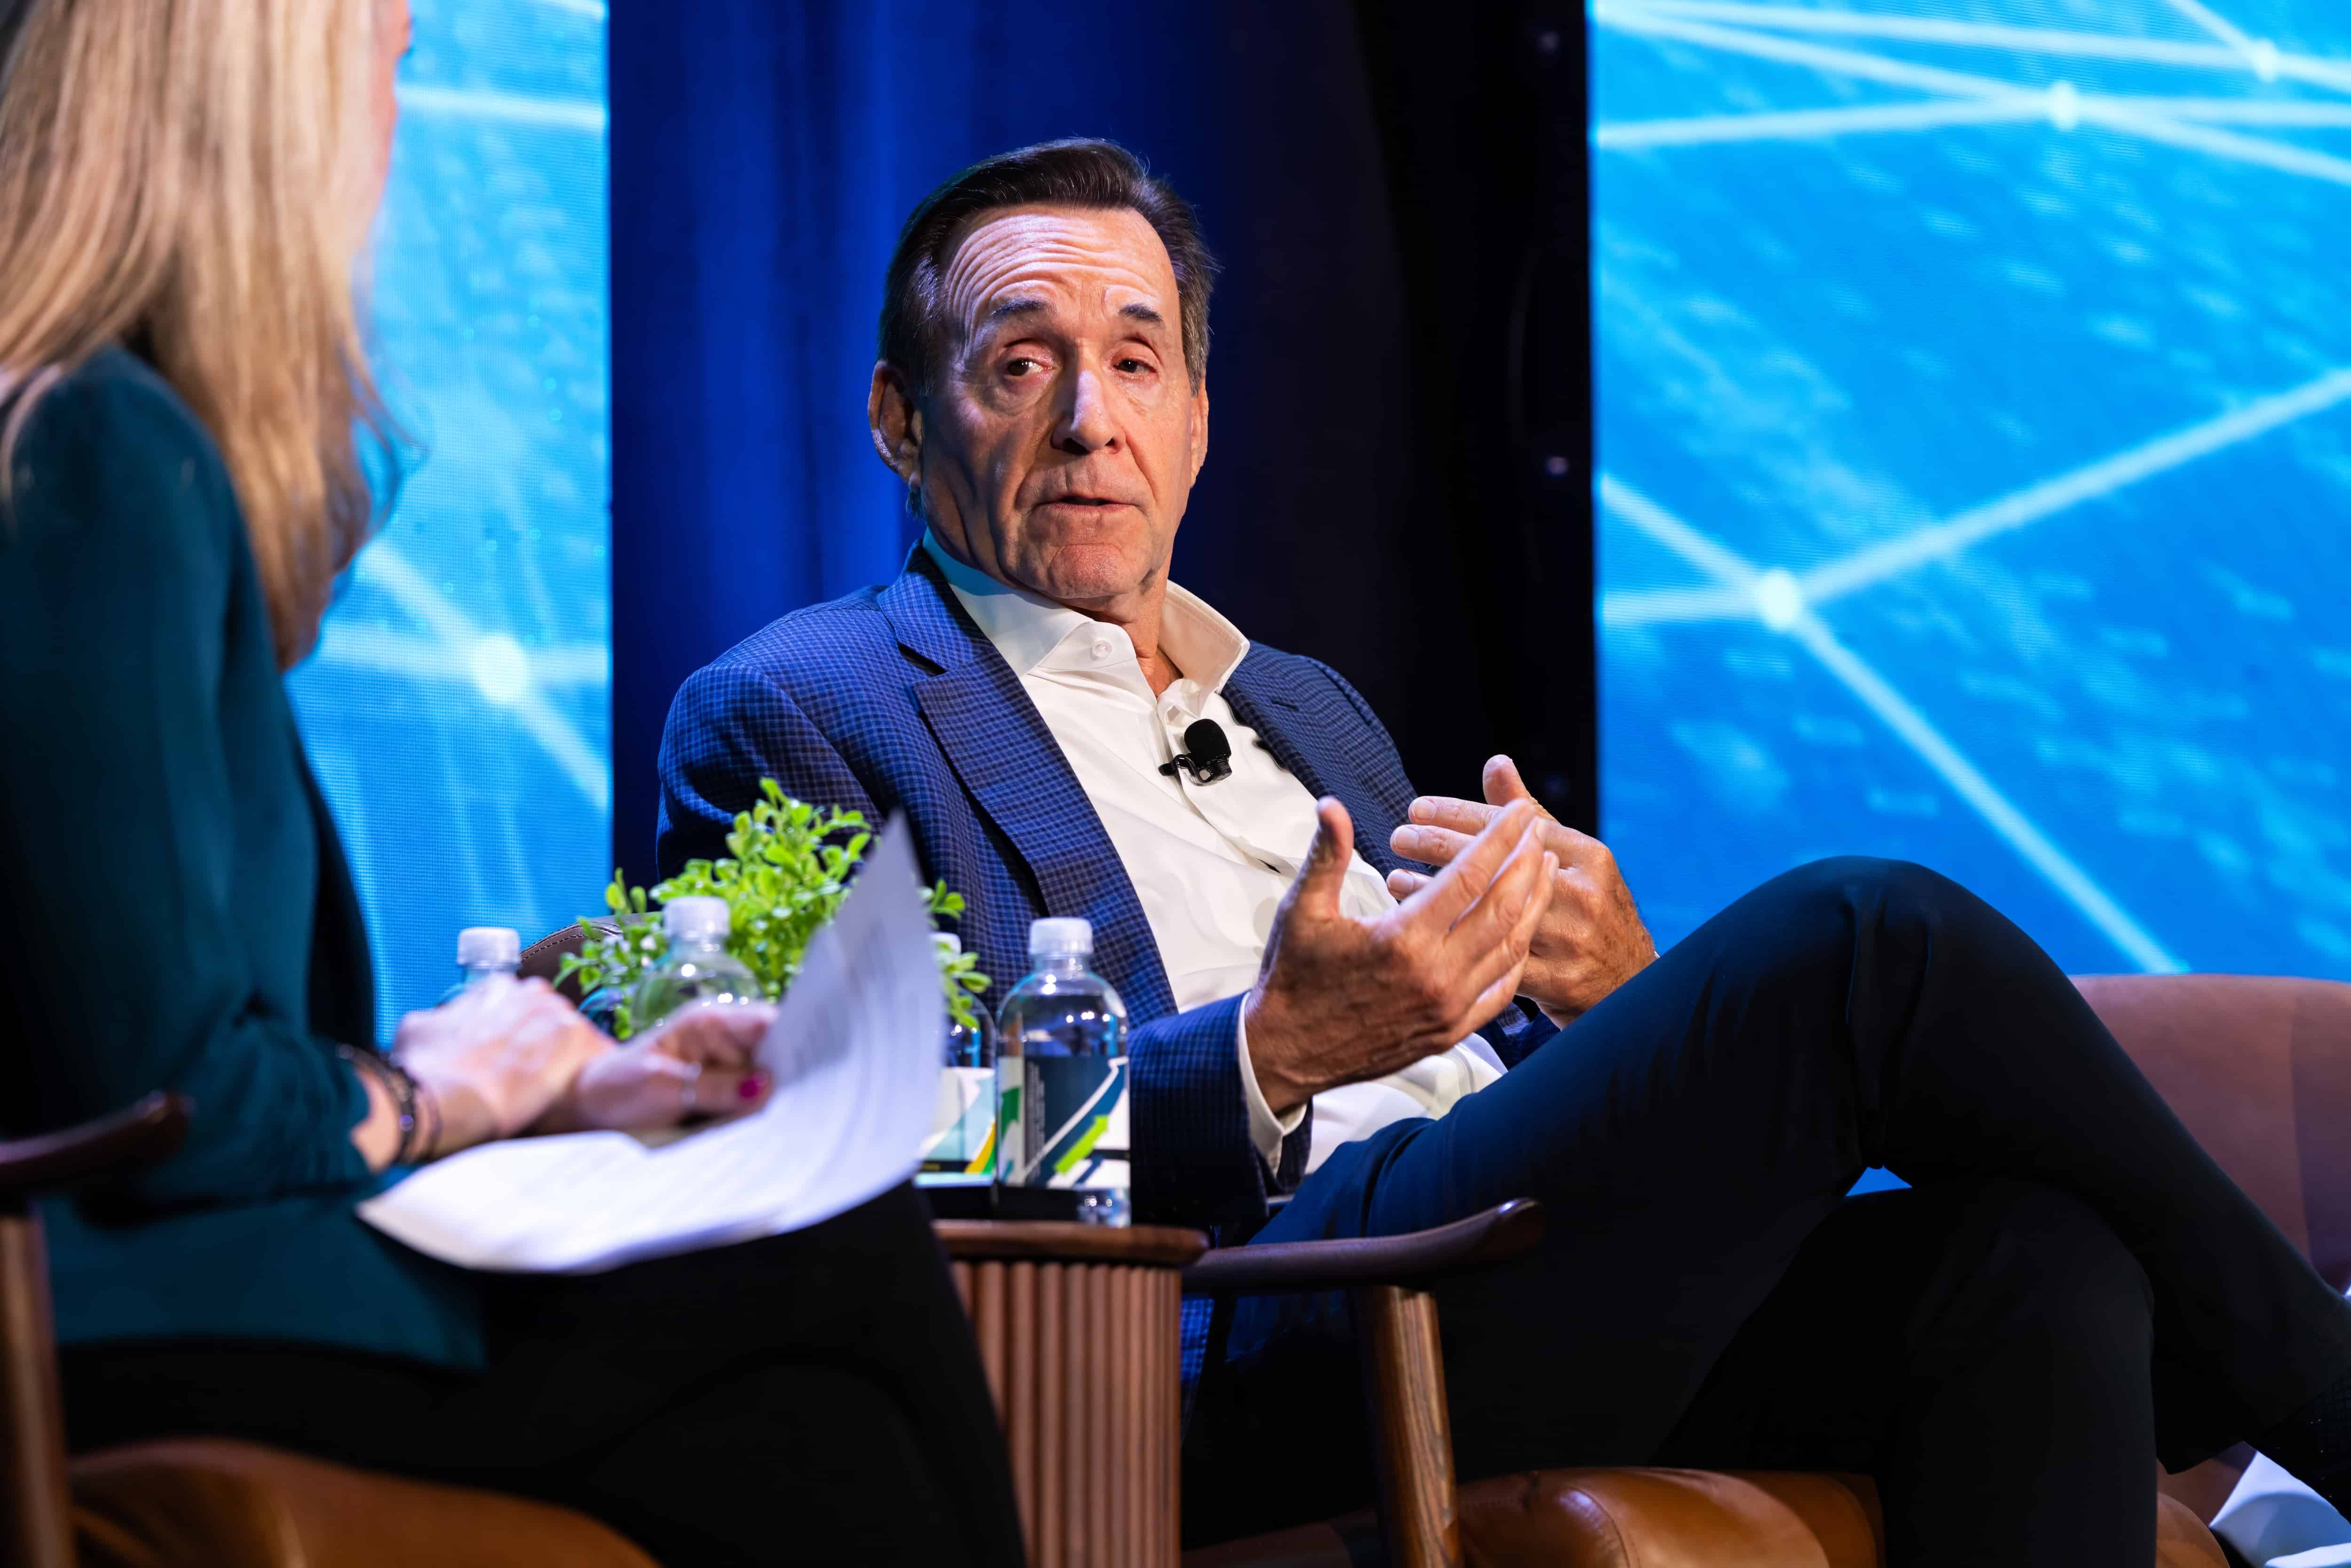
“You need to be disciplined to effectively grow and not let it impact what exists today,” said speaker Larry Cohen, CEO of Trustwell Living. He and many other speakers emphasized that growth is not simply about adding communities, but knowing why, where, and how to grow, and being disciplined enough to say no when an opportunity does not fit.
This was a central topic in the session Navigating Opportunity: When to Pursue, Pause, or Pass, which included Cohen. He and fellow panelists reinforced the importance of knowing what your organization does well and staying focused on opportunities that align with that strength. Growth can be exciting, but the wrong deal, market, or partner can distract from the existing business and put performance at risk.
The takeaway: good growth starts with a clear plan, a strong sense of identity, and the discipline to protect the business you already have.
In The Evolution of Organizational Structure for Growing Companies, speakers discussed how growth often requires operators to adapt their structure before the next opportunity arrives. That may mean investing earlier in corporate support, human resources, communications, technology, clinical oversight, or strategic partnerships. The message was clear: operators that want to grow sustainably need to build the foundation before growth strains the system. As speaker Quintin King, President of Brightwater Senior Living, stated, “I’m investing today for what I know I have to do tomorrow.”
Culture Can Be a Growth Strategy
Several sessions emphasized the importance of culture as a defining factor in whether an organization can scale successfully.
In Will Your Identity Shape Your Growth or Become a Casualty of It?, operators discussed how culture needs to be defined, nurtured, and adapted as an organization grows. Culture cannot live only with a founder or a small group of long-tenured leaders. As companies add communities, enter new markets, or integrate acquisitions, culture must be translated into hiring practices, leadership development, communication standards, values, and everyday behaviors.
“There is a direct correlation between culture and performance,” emphasized Brenda Connelly, President of The Springs Living. Fellow speaker Tom Grape, Founder, Chairman and CEO of Benchmark Senior Living, shared a similar perspective, noting that the goal should be to “grow to get better, not bigger.”
That distinction captured one of the conference’s strongest messages: growth should strengthen the organization, not dilute what made it successful in the first place.
Capital Partners Are Looking for Clarity, Performance, and Trust
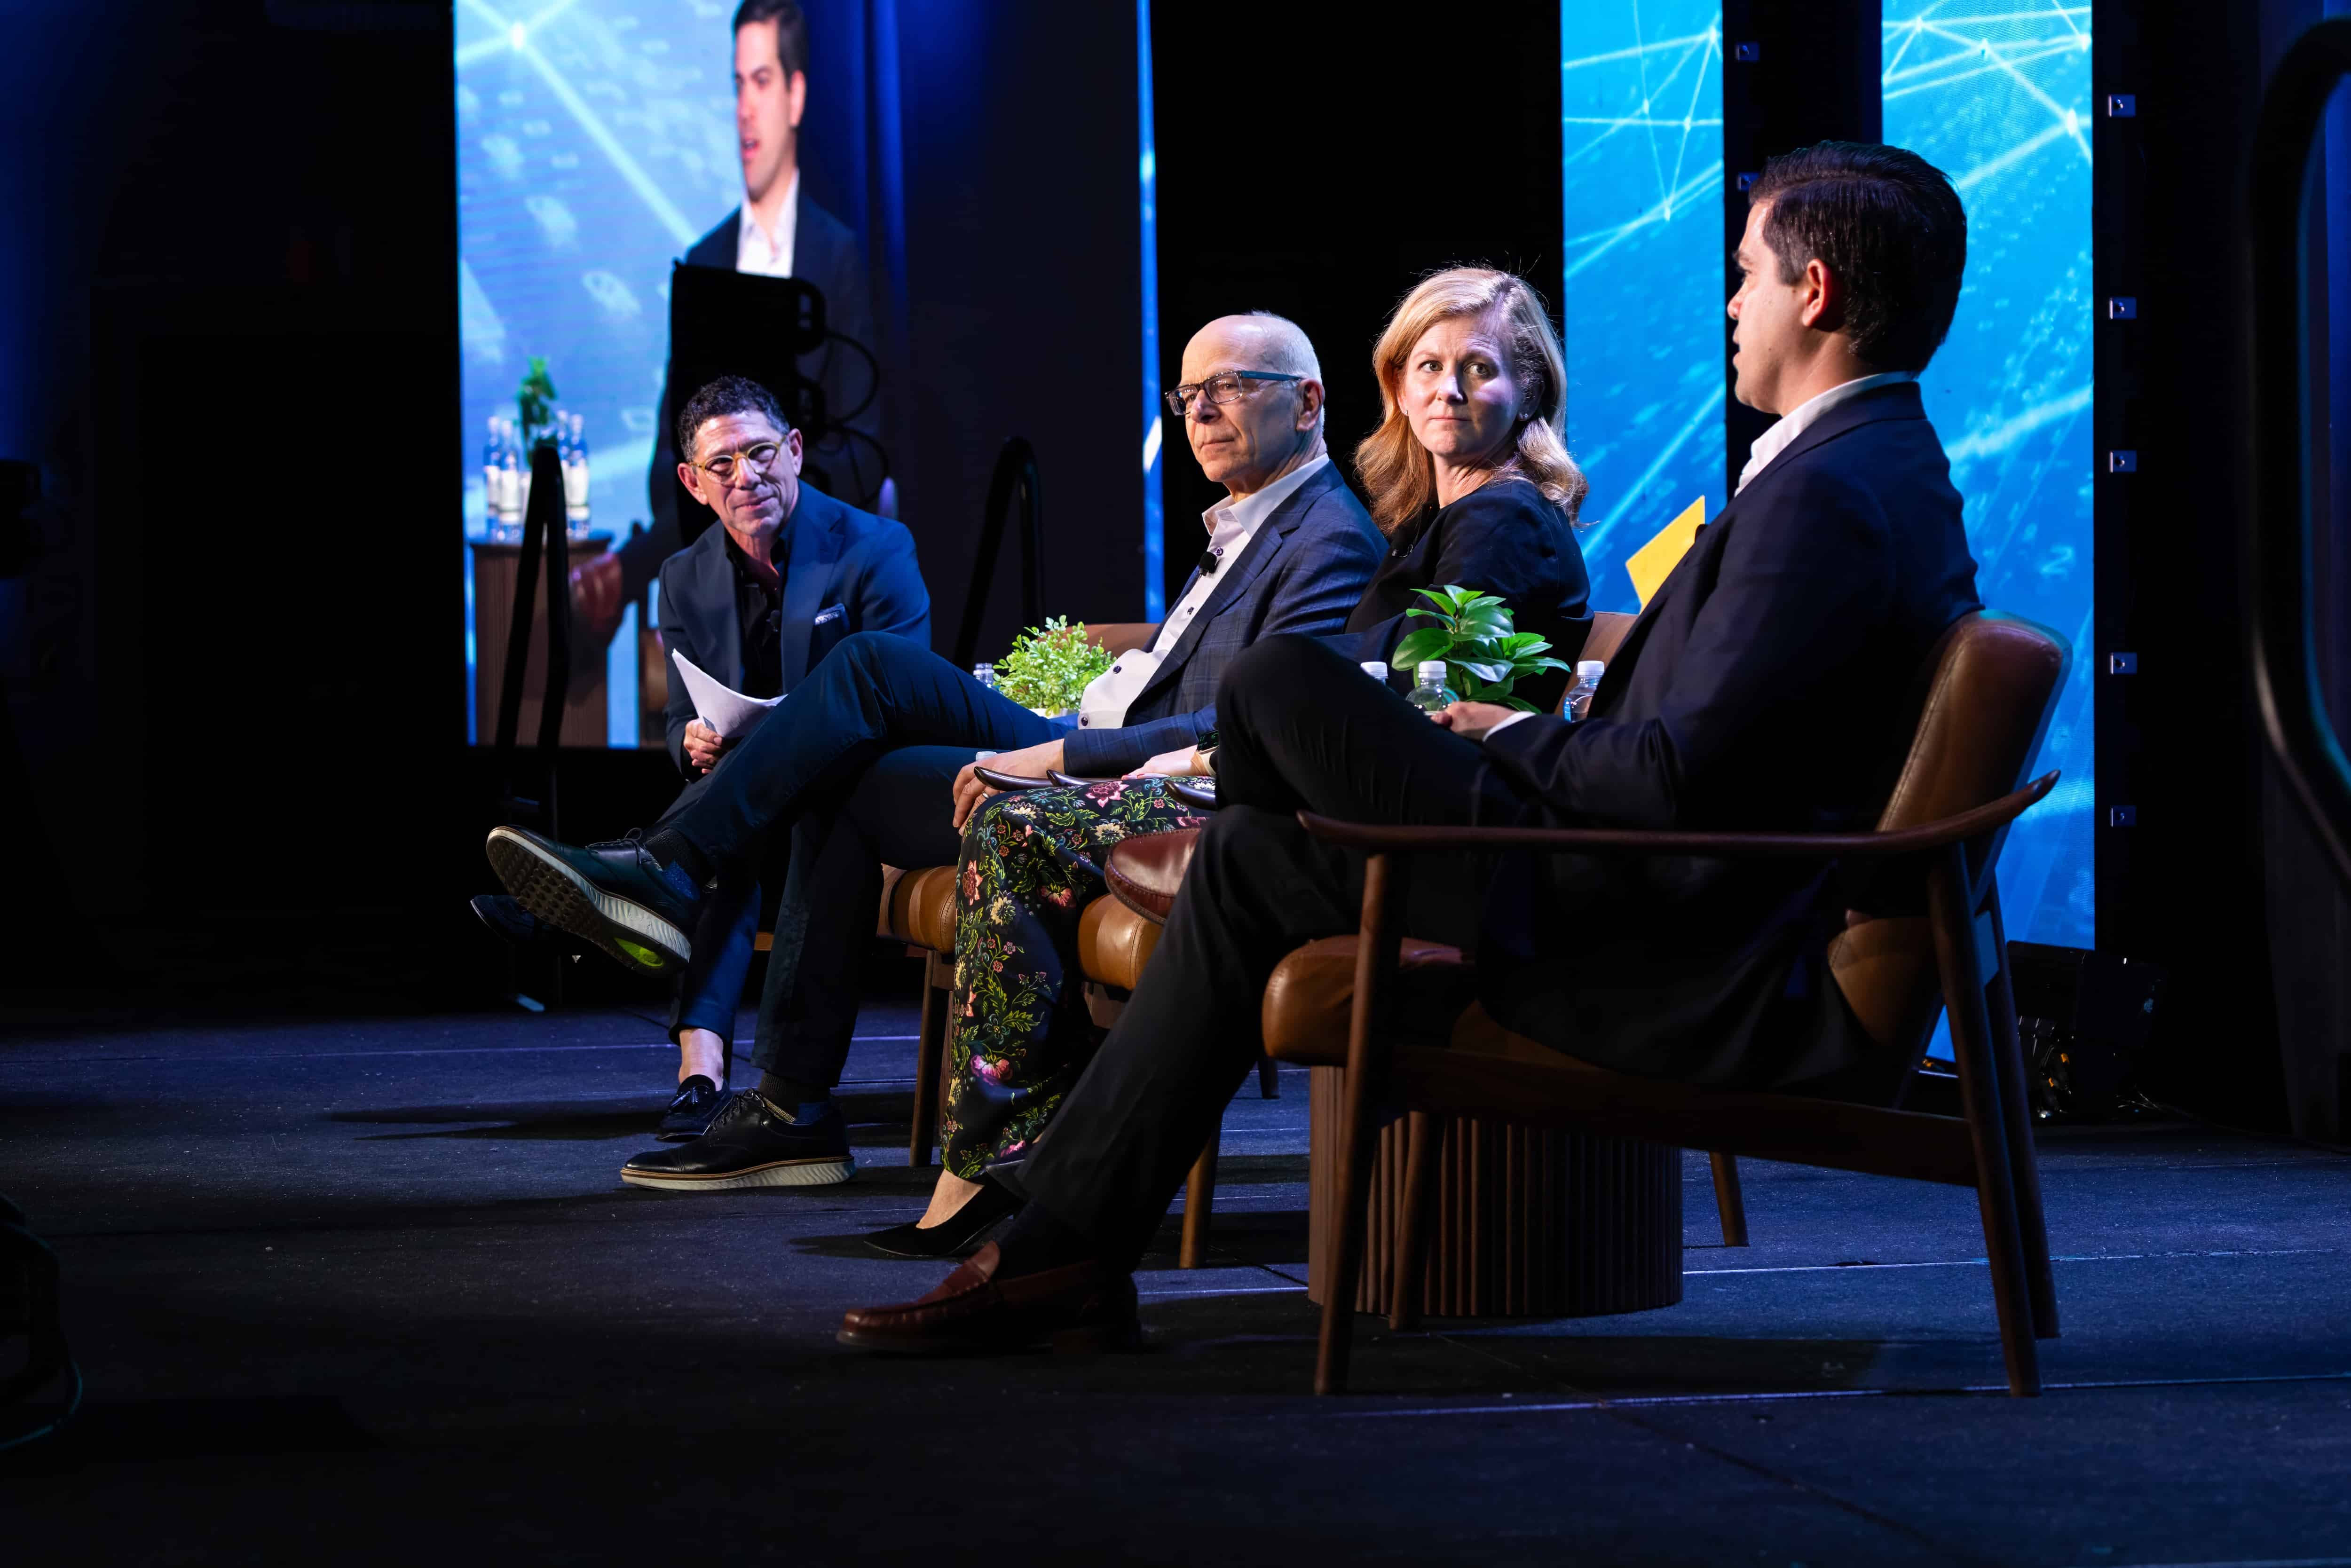
Operators seeking the secrets to what capital looks for in a strong partner learned that while a growth strategy matters, it must be backed by numbers, systems, leadership, and a realistic plan.
In Capital Across the Life Cycle: Practical Financing Strategies for Growing Operators,
speakers detailed how strong operators need to demonstrate a command of their numbers, the ability to explain performance at the community level, and the bench strength to scale without overextending the organization. “If the leadership isn’t set up well, it may not scale well or rebound off poor performance,” noted Garret Sacco, Managing Director at Berkadia.
Panelists also emphasized that capital partners want operators to succeed. They are not only evaluating financial performance, but also leadership, culture, communication, transparency, and whether the operator can make the transition from entrepreneurial to more institutional without losing what makes the company strong.
“Your capital wants you to win,” explained Dave Boitano, Executive Vice President and Chief Investment Officer for LTC Properties. “We are all on the same team and we want to be a resource.” He added that it’s an industry that rewards creativity and a vision that both sides can get behind. “Don’t grow a business that you grow to hate. Grow the business that you want to have.”
Technology and Data Are Now Growth Requirements
As today’s residents and families grow more comfortable using technology in daily life, integrating tech into your systems and business is a necessity. In Technology & Data: From Nice-to-Have to Growth Prerequisite, speakers discussed how technology decisions can either support or slow growth. Operators were encouraged to choose systems that fit where they are today while also preparing for where they are going.
The session highlighted the importance of clear ownership when implementing new technology, thoughtful pilot programs that include a realistic mix of communities, and practical data strategies that put the right information in front of the right people at the right time. Speakers also discussed the growing role of AI, not as a replacement for leadership or judgment, but as a tool that can help operators think differently, improve efficiency, and identify new solutions.
The broader takeaway was simple: as operators grow, technology and data can no longer be treated as side projects. They are core infrastructure.
Transitions, Partnerships, and Risk Management Matter More as You Scale
Growth often brings complexity, and several sessions explored the operational realities that come with expansion.
In Management Transitions & Integration, panelists focused on the people side of transitions. Residents, families, and team members need communication, consistency, and reassurance. “Families and residents want to know there will be consistency,” explained Doug Schiffer, President & CEO of Allegro Living. “They want to know they’ll have the same caregivers they are used to. It’s key that the transition does not create waves for the residents and families.” He noted that the local team must become an advocate for the transition, and leaders need to be transparent about what will change and what will remain steady.
In Advancing Growth Through Strategic Partnership Models, speakers explored how partnerships between for-profit and not-for-profit organizations can help organizations grow when traditional development is slow, capital is constrained, or expertise is needed. The strongest partnerships require alignment, clarity, and a shared understanding of each party’s strengths.
In Avoiding Hidden Risks in Resident and Staff Contracts, speakers reminded attendees that growth across markets also brings new legal, regulatory, employment, and contract considerations. Due diligence, vendor relationships, and outside expertise become increasingly important as organizations expand into new states or take on new operating structures.
Strong Brands Start with Authentic Differentiation
The session Utilizing Your Own Secret Weapon challenged operators to better understand and communicate what truly makes their communities different.
Speakers encouraged attendees to look beyond generic language like “vibrant,” “welcoming,” or “caring,” and instead identify the real stories, experiences, people, and operational strengths that set a community apart. The discussion connected marketing directly to operations: what a community says about itself must match what prospects, residents, families, and team members actually experience.
For smaller and mid-size operators, this can be a meaningful advantage. Their size, local presence, leadership access, team longevity, or unique culture may be exactly what makes them stand out.
Learning from Mistakes May Be the Most Valuable Growth Tool
The closing session, Growing Pains: The Mistakes We Made and the Lessons We Learned, brought the conference full circle. Speakers shared lessons from real growth journeys, including the importance of choosing the right partners, hiring people who understand and protect the culture, staying close to the consumer, and ensuring that mission and margin reinforce each other. “Choose partners that will be standing next to you when times are good and when times are bad,” reinforced Sue Farrow, Founder (Retired) of Integral Senior Living/Solstice Senior Living.
The discussion reinforced why the Growth Conference exists: to give operators and partners a space to learn from leaders who have been through the challenges of growth and are willing to share the lessons that can help others move forward more thoughtfully.
Looking Ahead
The 2026 NIC Growth Conference made one thing clear: the senior housing sector is entering a period where growth is both necessary and complex. Demand is rising, capital is engaged, and operators are looking for the right path forward. But successful growth will require more than ambition. It will require discipline, culture, data, capital alignment, operational readiness, and trusted relationships.
For leaders ready to continue these conversations, NIC will bring the industry together again this October in Chicago for the 2026 NIC Fall Conference. Join senior housing and care leaders, capital providers, operators, developers, and strategic partners for the connections, insights, and conversations shaping what comes next.