NIC Co-Founder and Strategic Advisor Robert Kramer has identified “Six Key Drivers” that will shape the senior living industry over the next 10 years. Kramer is also Founder & Fellow at Nexus Insights, a think tank to advance the well-being of older adults through innovative models of housing, community and healthcare. NIC Notes will publish a bi-weekly series detailing each key driver. What follows is an introduction to the series.
 What will the senior housing and care environment look like in 2032? It’s a question that has broad implications for the decisions we make today.
Do we understand the long-term impact of the pandemic and the changing make-up of our customer base? Can we anticipate their housing and service preferences? How is technology changing the senior living landscape? Where can we find the workers to meet the needs of our residents? How does healthcare fit in? Are we prepared for what’s ahead?
To anticipate the next decade, we need a clear understanding of the social, technological, and economic factors that form an ever-changing senior living environment. As a result, in my role as NIC’s strategic advisor, I have identified “six key drivers” that will shape our industry over the next 10 years.
To put the “six key drivers” in perspective, I’d like to highlight a quote: “The historic challenge for leaders is to manage the crisis while building for the future.” The quote appeared in an April 2020 op-ed in the Wall Street Journal by Henry Kissinger. He was comparing certain aspects of the COVID crisis to World War II.
In both cases, the challenge for leaders has been to manage the crisis, but at the same time to build for the future. That’s where our industry finds itself today.
Internal and External Threats
Our industry faces both internal and external threats. Internally, particularly among operators and their workforce, the mood is one of “exhaustion.” Exhaustion in every sense—physical, emotional and mental.
The senior living workforce from top to bottom is dealing with post-traumatic stress syndrome. But the real internal threat is exactly what Kissinger is talking about. It’s exhaustion that leads to a failure to anticipate and to prepare and therefore to build for the future.
The greatest external threat to senior living has long been considered “the home.” Elders would rather stay put in their long-time residences. But taking a wider perspective, the greatest external threat is from those outside our field who see the opportunity to serve our customers in a different, better and less expensive way than we do presently.
The threat comes at a time when the industry is not only exhausted but also under enormous financial pressure. We are depleted in terms of energy and resources. This is the classic prescription for “disruptive innovation,” the powerful concept developed by Harvard Business School Professor Clayton Christensen.
Big tech is making an advance into healthcare. Google, Microsoft, Apple, and Amazon all see an opportunity. So does big retail. Walmart, Best Buy and even Dollar General have major health initiatives under way. When I talk to the Health Strategy Officer of Walmart about our “Forgotten Middle,” he says: “That’s not only our customer, that’s our workforce. That’s the group we think we have the opportunity to serve.”
Retail pharmacy chains such as CVS and Walgreens see an opportunity too, along with the major insurers, including United Healthcare, Humana, Blue Cross Blue Shield, Anthem, and others. What do many of these outside disruptors have? In contrast to us, they have huge, positive brand recognition. They customize their services for the convenience of the consumer. These companies have great tech platforms that they’re constantly improving. Notably, they aren’t cash strapped, and they aren’t exhausted.
These companies can easily spend $50 million on an initiative and if it doesn’t work, it doesn’t really matter. That kind of money is a rounding error to them. In contrast, a $1 million tech investment for a senior living operator that goes sideways could have a huge impact or at least end any innovation by that operator.
Six Key Drivers
With that backdrop in mind, here are the six key drivers, in brief, which will impact our industry over the next decade. (Individual blog posts detail each driver.) Any futurist is never going to be 100% correct. But these key drivers are meant to serve as a challenge for the industry to think about how to manage the changes ahead.
- The COVID-19 Pandemic. The crisis has changed the way we work and ushered in the third generation of senior living.
- The Endemic Staffing Crisis. The labor shortage will continue. How can providers recruit and retain the best workers?
- A New Customer Arrives with a Different Take on Longevity. Our new customers want their lifespan to match their healthspan or wellspan. We need an engagement view of aging and retirement shaped by growth and opportunity, not by deficits and decline.
- Reframing Health and Healthcare. The focus will be on well care, not sick care. Senior living and healthcare providers, and insurers will partner to proactively keep our residents out of the expensive acute care system.
- The Increasing Importance of Data and Analytics. Market data by itself has limited value. In the future, market data will be coupled with personalized health, genomic, social determinants of health (SDOH), lifestyle and psychographic data, and aggregated by local market. The applications for the future use of this kind of data will be transformative for the industry.
- Moving from Siloed to Seamless. We will see a shift from the current fragmented, single-point healthcare solutions and technology applications to integrated longitudinal solutions that are setting, disease, and payer agnostic.
These six key drivers provide a discussion starter for senior living stakeholders to reflect on where the industry stands today, and how it will respond to emerging trends as the next decade unfolds. We welcome you to be a part of that discussion.
 The senior housing and care sector is constantly evolving, but fresh industry, economic, and societal pressures force owners and operators to be nimbler than ever to thrive. On July 13, NIC hosted its final Leadership Huddle of 2022 – Chris Taylor, managing director of Capital One Healthcare Real Estate led the conversation between senior living experts Cindy Baier, CEO of Brookdale Living, and Kimberly Lody, CEO of Sonida Senior Living, to explore how leaders can navigate change and utilize it to improve their organizations.
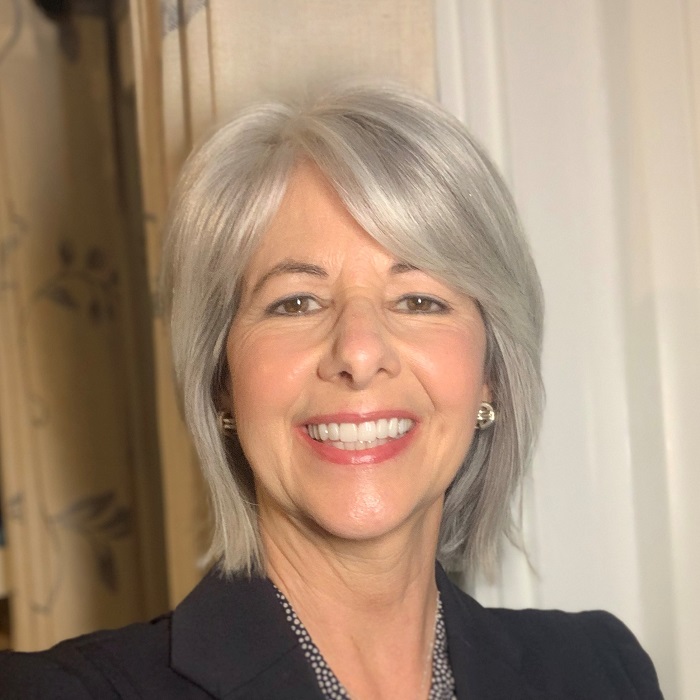
 Speaking broadly of leadership, Lody believes that a willingness to collaborate sets senior living apart from other industries. “There’s really not a moment of hesitation for people to raise their hand and say to you, ‘I’m happy to share with you what we’re doing.’” Baier sees the amount of passion among senior living leaders as a key differentiator. “It’s really the heart of people in this industry that I think is truly unique… how much people will sacrifice for others in this industry.”