It’s simple, right? Increase revenue or decrease expenses. Those are the two ways to boost net operating income (NOI). Ideally, senior housing and skilled nursing operators can do both.
But in today’s inflationary economic environment, increasing NOI and profitability can be a challenge. Higher wages and the cost of supplies are cutting into NOI. Occupancies are still recovering from the fallout of the pandemic, though operators do report some pricing power with recent rate hikes.
“We are looking at ways to create operating efficiencies, increase occupancy and drive rates,” said Adam Kaplan, CEO at Solera Senior Living.

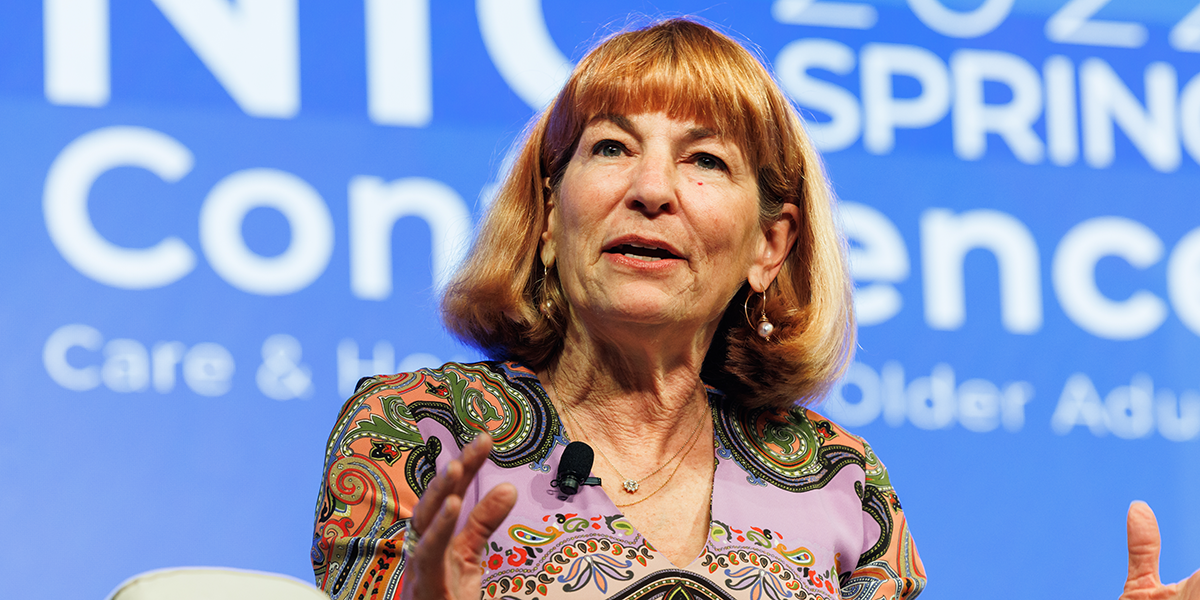
Kaplan spoke on a panel at the 2022 NIC Spring Conference titled, “How to Increase NOI Today, Tomorrow and into the Future.” He was joined by Lynne Katzmann, president & CEO at Juniper Communities, and Peter Longo, managing partner at Cantex Continuing Care Network. The session was moderated by Joel Mendes, senior director, Seniors Housing Capital Markets at JLL.
Each panelist showcased their proven strategies to boost NOI.
Solera positions itself as the price leader in the market. “We are focused on quality and being the best in every market where we operate,” said Kaplan. Solera provides a premium level of services, high-quality food options, robust engagement programs, and the latest technology.
The strategy has helped to sustain high occupancy levels along with the ability to raise rental rates by as much as 7-10%. Kaplan added that local supply and demand dynamics determine how much rents can be raised. “We take a very granular approach,” he said.
Efficient building designs help drive top line results and generate attractive yields for investors, Kaplan said. For example, new Solera properties have a single community entrance for all levels of care. The design creates a better resident experience and reduces expenses — only one entrance has to be staffed.
Juniper Communities leverages care integration to increase length of stay and augment care charges to boost NOI. Katzmann noted that care coordination is not the same as care integration. The approaches have some commonalities such as developing care plans and monitoring residents around the clock.
Care integration also includes primary care practitioners on site. Juniper’s Connect4Life model integrates onsite primary care, pharmacy, and lab services. “We started our own primary care practice,” said Katzmann. The practitioners can note changes in resident health and take quick action. They also serve as a support for the community team.
Primary care practitioners enter their notes into an electronic system at the community, so coordination is seamless. “We act as a bridge between chronic care management and the medical system,” said Katzmann. “Our resident outcomes are better which impacts NOI.”
Higher NOI, Higher Value
Juniper conducted research on the impact of care integration on NOI. Juniper compared its population to the general population and found that the hospital readmission rate was 80% lower among its residents. The use of the emergency department was 15% lower.
The study showed an increase in NOI of $113,000 a year per property, Katzmann said. Assuming an 8% cap rate, for example, property value would be increased by $1.4 million.
Juniper also introduced a Medicare Advantage Plan. This allows Juniper to be paid for care integration from the savings it produces for Medicare.
Panelist Longo at Cantex, which owns and operates a number of skilled nursing facilities, started a Medicare Advantage plan for residents. “It’s had a major impact on how we deliver care and the outcomes,” he said. Residents can sign up for the Medicare Advantage plan. Nurse practitioners deliver care. Cantex is rewarded for better outcomes since healthier residents need less care and fewer expensive interventions.
Practitioners can coordinate home health and hospice care for residents not in the plan. Another benefit: The staff at the building has embraced the approach. “Nurse practitioners proved their worth during the pandemic,” said Longo.
Session moderator Mendes posed a question to the panelists: How much does it cost to set up a Medicare Advantage plan?
“You need capital,” said Longo, adding that it could cost $1 million or more depending on state regulations and other requirements. Scale is also necessary. He said that 60-80 residents are needed for it to make sense to hire a nurse practitioner. About 5-10 facilities should be geographically clustered to share services and circulating nurse practitioners.
Kaplan agreed that a wellness approach is integral to a high-quality operation. At Solera, nurses are available 12 hours a day, every day. But the healthcare operations run in the background. “We focus on lifestyle,” he said. “We are at the intersection of healthcare, real estate and hospitality.”
As the session concluded, panelists agreed that technology, while expensive, is a must-have to boost NOI. The right technology allows the company and the staff to operate efficiently. The ability to capture and communicate real time data is also critical to demonstrate value to partners.
The 2022 NIC Fall Conference is coming up next month. See upcoming sessions and register today.


 While senior living providers struggled with labor shortages prior to the pandemic, the crisis not only exacerbated the problem but brought into bold relief the enormous staffing challenge the senior living industry will continue to face over the next 10 years. Just as the pandemic has become endemic—a situation we must adjust to and live with—so too the staffing crisis will be an ongoing issue that requires radical new approaches.


