In early 2024, the NIC SHARK report – an in-depth analysis that issued a call to action following the disruption of the pandemic – laid out a forward-looking view of the senior housing sector, grounded in demographic momentum, constrained new supply, and a demand trajectory projected to push occupancy to new heights. A year later, the data is in, and the market is moving as anticipated. Senior housing occupancy momentum is not only tracking with projections made in our SHARK report, but occupancy growth is also outperforming other major commercial real estate (CRE) sectors for the first time in nearly two decades.
Yet with momentum comes new challenges. Labor constraints, tightening immigration policy, and tariffs influencing construction inputs are creating friction that will shape development, staffing, and capital decisions in the years ahead.
Key Takeaways – One Year After the Inaugural NIC SHARK Report
- Occupancy is on track with SHARK projections and is expected to surpass peak levels not seen since 2008.
- Senior housing occupancy growth is now outperforming other CRE asset classes, which has the potential to attract additional capital inflows from investors.
- Investor interest is increasing, but labor constraints, immigration policy shifts, and tariffs continue to pose operational and development challenges.
- Occupied unit levels continue to grow steadily, with no signs of a demand cliff, but the market is entering a new phase.
- Senior housing projects will likely continue to be built at above-replacement cost in 2025, pushing transaction volumes and per-unit pricing higher.
- Approaches to greater construction efficiency are emerging but need greater scale and adoption. Meeting rising demand requires building and designing smarter, with different approaches than in the past.
1. Occupancy is Right on Track
As projected in the first segment NIC SHARK report, senior housing occupancy levels across most regions have reached or exceeded 2024 benchmarks. Behind this rise is the broad-based demand across both needs-based and lifestyle-choice property types, limited inventory growth, and the continued strength of the absorption-to-inventory-growth velocity (AIV) ratio. In 2024, the AIV ratio stood at 27:10 across the 99 NIC MAP Primary and Secondary Markets, well above the threshold needed to drive continued occupancy gains.
The exhibit below shows that by the end of 2026, senior housing occupancy in most regions is projected to surpass the peak levels recorded since 2008. Notably, the Secondary Markets, East North Central, Mountain, and Southwest regions are the closest to reaching those historic highs, with the gap ranging from 1.0pps in the Mountain region to 1.6pps in the Southwest.

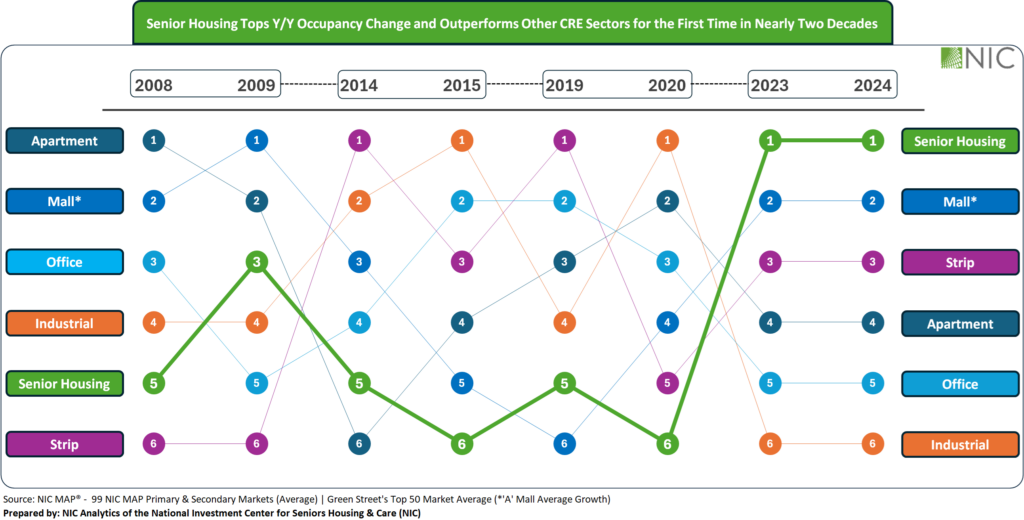
2. Senior Housing Occupancy Growth Outperforms Other CRE Sectors
In a notable shift and for the first time in nearly two decades, senior housing occupancy growth is now outperforming traditional commercial real estate (CRE) sectors such as apartment, strip malls, office, and industrial.
In today’s higher-interest rate environment with tighter capital availability, senior housing’s resilience, reflected in stronger occupancy growth in recent years has attracted growing attention from institutional and private investors. With its stable, forward-looking, and demographically anchored growth, senior housing stands out in the broader CRE arena. In fact, in an October 2024 ULI poll, senior housing ranked second only to data centers in projected risk-adjusted returns over the next three years.
3. Investor Interest Is Rising, But So Are Friction Points
The uptick in investor interest is real. Many debt lenders, brokers active in the space, and entities raising funds for senior housing investment, all observe an increase in the volume of new investor entrants into the market. Transaction volume picked up in 2024 and capital is increasingly looking toward ground-up development again. However, labor availability remains a top concern, now exacerbated by immigration policy shifts. Operators are contending with limited pipelines of frontline and clinical staff, a challenge that could limit the pace of new move-ins and elevate wage pressure.
Additionally, tariffs and supply chain issues have the potential to continue to influence construction timelines and costs, further contributing to the likelihood that new projects will remain above replacement cost through at least 2025, and development activity will be limited.
4. Occupied Unit Growth Continues at a Disciplined Pace
Occupied unit growth continued at a measured and disciplined pace with no sign of a demand cliff on the horizon. As projected, occupied penetration rates continued to rise steadily across regions, reflecting a healthy alignment between the number of aging households and the supply of available senior housing units. But with most new projects taking years from planning to delivery, today’s steady and strong absorption signals a clear need to start building now to meet the demand rooted in long-term population trends.
5. Supply Remains Moderate, but Pressure is Building
Construction activity remains subdued, and the market is not at risk of being oversupplied. However, with occupancy rising and new projects facing multi-year timelines, senior housing is approaching a new phase. By 2026, stronger demand, combined with a potential undersupply of new inventory, is expected to drive upward pressure on pricing, and developers will need to take a thoughtful approach aligning rising development costs with affordable rent.
6. Construction Efficiency* will Emerge out of Necessity
Rising costs and prolonged timelines are prompting more developers to explore modular construction, off-site fabrication, and smarter design strategies. While still early in adoption, these approaches reflect a growing recognition that meeting future demand will require building smarter, not just building more.
As senior housing stakeholders look ahead to 2026 and beyond, the next phase will require translating accurate forecasts into strategic action, balancing optimism with realism, and growth with discipline.
*Learn more about construction efficiency.