CCRC Performance 1Q 2026: A Regional View of Entrance Fee and Rental CCRC Occupancy
The following analysis examines broader occupancy trends, year-over-year changes in inventory, and same-store asking rent growth – by care segment – within 1,038 Continuing Care Retirement Communities (CCRCs) and 13,708 non-CCRCs in the 99 NIC MAP Primary and Secondary Markets.
1Q 2026 Market Fundamentals by Care Segment – CCRC (All) vs. Non-CCRC
The exhibit below compares the market performance of CCRCs and non-CCRCs by care segment for the first quarter of 2026, highlighting year-over-year changes in occupancy, inventory, and asking rent growth.
Occupancy. Consistent with prior quarterly results, CCRCs continued to outpace non-CCRCs in occupancy rates across all care segments. The largest occupancy difference between CCRCs and their non-CCRC counterparts in the first quarter of 2026 was in the independent living segment (3.7pps), with the smallest gap in the nursing care segment (1.5pps). The independent living segment recorded the highest occupancy rate among both CCRCs (93.7%) and non-CCRCs (89.9%).
Non-CCRCs recorded higher year-over-year occupancy changes in all care segments except for the nursing care segment, with independent living recording the highest change from the past year (2.5pps). While CCRCs overall have higher occupancy, the occupancy growth has been slower compared to non-CCRC communities.
Asking Rent. The average monthly asking rent (in dollars) for CCRCs continues to be higher than that of non-CCRCs across all care segments except for the independent living segment. Non-CCRCs experienced stronger year-over-year rent growth in all care segments with assisted living and nursing care segments showing the highest growth (5.0%).
Note that these figures represent asking rates and do not reflect any discounts that may be applied. The nursing care average daily rent is the average private pay per diem rate.
Inventory. Compared to the level a year ago, nursing care inventory declined in both CCRCs (1.3%) and non-CCRCs (0.2%), the largest drops among the care segments. Among CCRCs, positive inventory growth was seen in the memory care segment (0.7%), while assisted living and independent living edged down slightly by 0.4% and 0.3 respectively.
For non-CCRCs, the strongest year-over-year inventory growth was recorded in assisted living (1.2%) and memory care (0.8%) segments, while nursing care declined.
Negative inventory growth can occur when units or beds are temporarily or permanently taken offline or converted to another care segment, offsetting any newly added supply.
Every Region Delivered Year-over-Year Occupancy Gains in 1Q 2026 Across Both Entrance Fee and Rental CCRCs
In the first quarter of 2026, entrance fee CCRCs continued to outperform rental CCRCs in occupancy rates across all regions, with every region posting year-over-year gains compared to the first quarter of 2025. The Mid-Atlantic region led with the highest entrance fee occupancy at 94.3%, followed closely by the Northeast at 94.0% and the Pacific at 93.9%. Meanwhile, the Southwest region (89.5%) recorded the lowest, although still up 0.7 percentage points (pps) from a year earlier. The West North Central region posted the largest year-over-year gain among entrance fee CCRCs at 3.5pps, climbing from 88.8% to 92.3%, followed by the Pacific (2.7pps) and the Mountain regions (2.1pps).
For Rental CCRCs, the Northeast region recorded the highest occupancy at 93.1%, an increase of 1.6pps from the first quarter of 2025, while the Southwest reported the lowest at 87.8%. The East North Central region posted the strongest year-over-year improvement at 1.8pps, rising from 88.0% to 89.8%, with the West North Central (+1.7pps) and Northeast regions (+1.6pps) close behind.
Look for future articles from NIC to delve into the performance of CCRCs.
Independent Living Rate Growth Moderates, While Assisted Living Accelerates
Data from the recently released 1Q 2026 NIC MAP Seniors Housing Actual Rates Report showed that:
In the first quarter of 2026, year-over-year rate growth across all rate categories for independent living properties moderated from the record highs reported in early 2025. In March 2026, year-over-year growth in in-place and asking rates were 6.1% and 7.4%, respectively, representing a deceleration compared with March 2025. Meanwhile, year-over-year growth in initial rates stood at 2.3%.
Assisted living properties continued to report relatively strong year-over-year rate growth across all rate types in the first quarter of 2026. In March 2026, year-over-year growth in in-place, initial, and asking rates were 6.5%, 7.8%, and 7.2%, respectively, representing an acceleration compared with March 2025.
In the first quarter of 2026, discounts between asking and initial rates widened for independent living properties compared to the year-earlier level. In contrast, assisted living properties saw discounts narrowing from the previous year.
Average initial rates for independent living properties were 11.2% ($543) below asking rates in March 2026, equivalent to a 1.3-month discount on an annualized basis, up from the 0.8-month discount in March 2025.
For assisted living properties, average initial rates were 7.3% ($515) below asking rates in March 2026, translating to a 0.9-month discount on an annualized basis, compared with a 1.0-month discount in March 2025.
Additional key takeaways are available to NIC MAP subscribers in the full report.
About the Report: The NIC MAP Seniors Housing Actual Rates Report provides aggregate national data from over 300,000 units within more than 2,800 properties across the U.S. operated by over 65 seniors housing providers. Visit the NIC MAP website for more information.
Active Adult 2.0: Lessons Learned and New Opportunities
As the active adult sector emerged over the last decade, investors, developers and operators have gained a clearer understanding of the strategies and models that drive success—and those that fall short.
To assess the evolution of the sector, top leaders gathered at the 2026 NIC Spring Conference to discuss lessons learned and new opportunities in the active adult market.
In opening remarks, panel moderator Matt Pyzyk of Green Courte Partners set the stage by reiterating NIC’s definition of active adult properties: age-qualified, market-rate, multifamily rentals that emphasize lifestyle and do not include meal service.
Pyzyk noted that the typical active adult resident is widowed or divorced, in her late 60s or early 70s, downsizing, and may still be employed. He added that the active adult inventory has increased 36% since 2016.
The panel discussion focused on five key insights.
Recruit the right talent, create a sense of community. Though active adult communities have many fewer employees than senior housing properties, the on-site staff is key, the panelists agreed. “Staff retention corelates with resident retention,” said Eddy O’Brien of Blaze Capital Partners. “Taking time upfront to get the right staff pays dividends.”
Also key: the community manager must be a sales leader, and lifestyle programming is essential for success. During lease-up, a staffer must spearhead programming to engage residents and demonstrate to prospects that the community offers a full and active lifestyle. Once programming has momentum, residents can typically manage that aspect of operations themselves, according to Jim Lindsey, BVO Capital. “The goal is to make the community self-sustaining,” he said.
Design and amenities make a difference. Baby boomers prefer modern designs and active environments with communal spaces that promote interaction, such as pickleball courts, rooftop terraces, and open demonstration kitchens. Apartments tend to be larger than conventional multifamily units, but the projects themselves are generally smaller than they were 10 years ago when the product was less well defined.
“We target 165 units,” said Lindsey, describing BVO’s middle market product. These projects are less costly to build than luxury communities and can be leased in a reasonable time period. Amenities are located in the main building, instead of in a clubhouse, so residents don’t have to walk across a parking lot to participate in activities. Ashley Fitzgerald of The Carlyle Group noted that amenity spaces in active adult developments are larger than those in conventional multifamily buildings. But active adult amenity spaces are flexible and can accommodate multiple purposes. “We don’t need a 1,500-square-foot craft room,” she said.
Cottage-type products are being introduced and perform well, according to O’Brien of Blaze Capital Partners. He added that the average age of cottage residents is younger than those in apartments. Cottages also command rent premiums of 20-30%. But, he added, “We think a mix of cottages and apartments is the right combination in a development.”
Pre-leasing is key. “The duration of the lease-up is the biggest risk,” said Fitzgerald.
Michael Levine of Greystar said that the first year is pivotal. It’s important to show the community is active which requires about 35-40% of the building to be leased. The panelists agreed that market education is needed to reach consumers unfamiliar with the active adult product and its benefits. “We are still a young sector,” said Levine.
Local conditions drive rent growth. Stabilized active adult communities typically command rents about 5% higher than traditional multifamily properties, the panel agreed. But rents depend on the local housing markets and other metrics. A soft housing market may keep rents in check.
But looking ahead, the panelists expect solid rent growth at active adult communities. Existing multifamily and active adult properties are likely to absorb additional space, and new development is expected to remain constrained. “Rents could go higher in 12-18 months,” said Lindsey.
Maintain a limited-service model. As residents age, it’s tempting to offer more services. But, Pyzyk cautioned, “Active adult is lifestyle programming.”
Greystar sticks to a staffing model similar to that of multifamily properties. Interestingly though, Greystar is introducing a preventative healthcare program at an active adult community in Missouri because its average resident age is trending higher. But, Levine said, “We are not bringing in meals, home care, or home health. We are not independent living.”
From Anecdotes to Operational Intelligence: The New Data Opportunity in Senior Living
Ask any senior living operator, and they will have a finger on the pulse when it comes to their financial KPIs and metrics. Raw food costs, labor costs, agency spend, utilities, insurance, NOI, operating margin; you name it, the majority of operators can pull up their spreadsheet or dashboard and immediately provide insights and produce reports.
What has been a bit more of a blind spot is the day-to-day operational visibility within a community.
For years, many of the most important interactions happening inside a community (think caregiver response times, resident engagement patterns, staffing workflows, and day-to-day care delivery), were difficult to measure in a meaningful way. Operators often relied more on anecdotal feedback rather than objective data to understand what was happening on the floor.
But that is beginning to change.
As resident acuity rises and workforce pressures continue, operators are increasingly recognizing the value of operational data: real-time insights into how care is actually being delivered throughout the day. This type of visibility is helping communities improve staffing efficiency, strengthen family communication, and make more informed and timely care decisions.
One area where this shift is especially impactful is family engagement.
When family members raise concerns about responsiveness or care quality, conversations can quickly become emotional. Historically, operators had limited tools to validate or refute those concerns beyond staff recollection or fragmented documentation.
Today, increasingly communities are embracing modern operational platforms that allow them to access objective information around response times, caregiver interactions, planned and unplanned care, and patterns of resident assistance. Executive directors can use this data to identify trends, address issues proactively, and provide families with greater transparency into the resident experience.
The data is also helping communities better substantiate changes in resident acuity and level of care needs. Instead of relying solely on periodic assessments, operators can now evaluate actual patterns of assistance and engagement over time, creating a clearer picture for both care teams and families.
Importantly, operational data is no longer something reviewed only in monthly reports. Many operators are now incorporating these real-time insights into their daily stand-up meetings and staffing discussions to better understand where workflows are succeeding and where additional support may be needed.
This evolution is also accelerating the need for deeper technology integration.
For years, senior living technology largely functioned through disconnected point solutions. But as operational complexity increases, communities are looking for more unified platforms that connect care workflows rather than fragment them.
That is where integrated technologies like nurse call, fall detection, insights platforms, and care plan tasking are becoming increasingly valuable. When these systems work together within a single operational platform, operators gain a more complete understanding of both resident needs and staff workflows in real time.
Integration with electronic health records (EHRs) is also becoming especially important. By connecting operational workflows with clinical documentation, communities can bridge planned and unplanned care into a more seamless caregiver experience. Moving beyond point solutions and toward connected care platforms that unify communication, response, documentation, and operational intelligence in one workflow advances the industry forward. The result is improved efficiency for frontline teams and stronger operational intelligence for leadership.
At the same time, technology adoption in senior living still comes down to implementation.
Communities operate around the clock, and caregivers have limited time to adapt to new systems. Successful adoption requires hands-on partnership, on-site support, and training that reflects the realities of senior living operations.
Ultimately, the future of senior living will be defined by those operators who, with the support and leverage of their technology partners, turn operational data into actionable insights that improve care, support staff, and build trust with families.
Cautious Optimism Continued in Second Half of 2025 as Lending Activity Improved and Capital Reengaged
NIC Analytics released the NIC Lending Trends Report for the second half (2H) of 2025. This complimentary report includes data trends over nine years for senior housing and nursing care construction loans, mini-perm/bridge loans, permanent loans, and delinquencies from third quarter 2016 through fourth quarter 2025. The report is based on survey contributions from 18 participating lenders.
In 2H 2025, the Federal Reserve resumed easing, cutting the federal funds rate three times–in September, October, and December–bringing the target range down from 4.25%-4.50% to 3.50%-3.75% by year-end. The Fed described the cuts as a response to a shifting balance of risks, while continuing to emphasize that future policy decisions would depend on incoming data, the economic outlook, and inflation progress.
Looking into 2026, the Federal Reserve has not implemented any rate cuts as of June 2026. In fact, expectations for additional rate cuts in 2026 have faded gradually in recent months due to persistent inflation pressures, rising energy prices, and geopolitical uncertainty. Several market forecasts and economist surveys now expect the Fed to remain on hold through most, if not all, of 2026. As a result, lenders are likely to remain active yet disciplined, with continued focus on sponsor strength, and overall debt capacity.
Survey Comments from the Field: Lenders remained disciplined but increasingly competitive in 2H 2025, with stronger desire for both new and existing borrowers.
NIC’s lending survey gathers both data for inclusion in the Lending Trends Report and commentary on what is driving those trends. A summary of that commentary is provided below.
Credit standards in 2H 2025 remained largely consistent with the first half of the year, with most lenders reporting no major changes in underwriting requirements across senior housing and nursing care. However, several respondents noted that the lending environment continued to become incrementally more competitive and borrower-friendly, particularly for high-quality operators and well-performing assets.
Relationship-driven lending remained the dominant theme, while onboarding activity stayed strong. Most lenders continued extending loans to existing borrowers while also actively pursuing new clients, particularly experienced and well-capitalized operators. Several respondents also noted a rise in acquisition financing opportunities and first-time borrowers entering the market.
Competitive pressure among lenders appeared to increase in 2H 2025. Multiple respondents highlighted tighter spreads, more aggressive bank pricing, and increased flexibility in deal structures. At the same time, debt-service coverage constraints continued to weigh on underwriting, particularly in the context of still-elevated interest rates. Even so, lenders reported an increasing pace of loan applications and approvals, reinforcing the view that capital availability continued to improve heading into 2026.
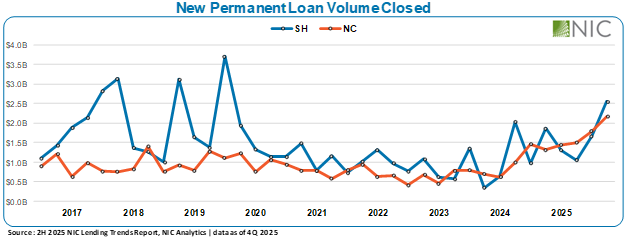
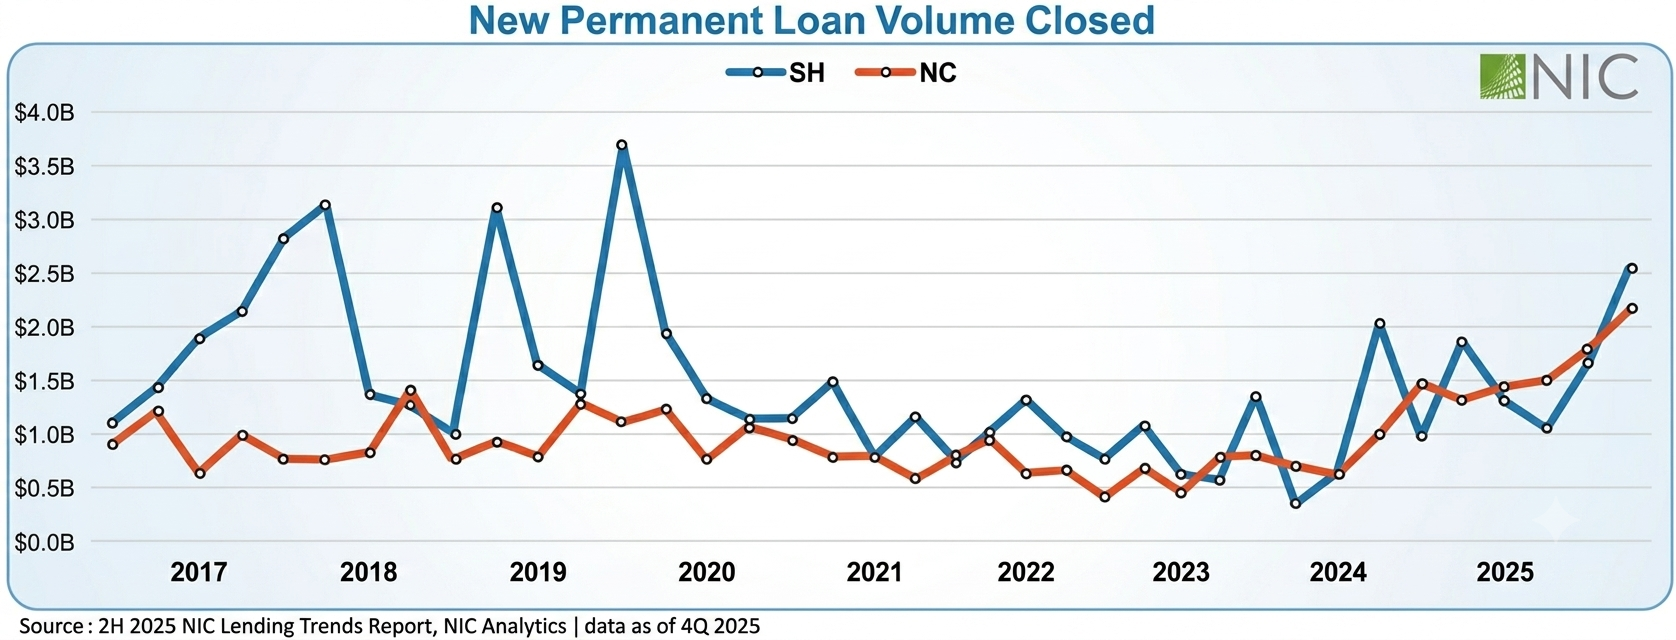
Permanent lending jumped in 2H 2025, reaching multi-year highs in senior housing and record levels in nursing care.
Permanent lending activity accelerated in 2H 2025 across both senior housing and nursing care. Senior housing permanent loan volume reached approximately $4.2 billion in the second half of the year, including $2.5 billion in the fourth quarter alone, bringing activity to its highest level since mid-2019. The increase was supported by stronger acquisition financing demand, improved property fundamentals, and a more competitive lending environment as banks and other capital providers became increasingly active in the space.
Nursing care permanent loan volume also continued its upward trajectory, totaling approximately $4.0 billion in 2H 2025 and reaching the highest level in the time series.
Overall, 2H 2025 marked one of the strongest permanent lending environments seen in several years. Relatively lower policy rates, tighter spreads, and increased lender appetite helped support robust deal flow, although underwriting discipline and debt-service coverage requirements remained key considerations across both sectors.
Bridge lending reached record levels in 2H 2025, driven by strong activity in senior housing and a sharp rebound in nursing care.
Mini-perm and bridge lending activity accelerated further in 2H of 2025, reaching some of the strongest levels observed in the time series. In senior housing, bridge loan volume totaled approximately $2.4 billion across the third and fourth quarters, marking the highest two-quarter total on record since at least 2016. Activity remained elevated throughout the period, reflecting growing lender confidence in short-term financing opportunities and continued demand for acquisition, repositioning, and lease-up capital.
Nursing care bridge lending remained more volatile but still reached new highs by year-end. After declining sharply in the third quarter, volumes rebounded significantly in the fourth quarter to more than $1.1 billion, establishing a new quarterly record in the time series for the sector.
Overall, bridge lending in 2H 2025 reflected a more active and competitive financing environment across both sectors. Banks and alternative lenders continued expanding their presence in the market, although underwriting discipline remained intact, with capital still concentrated among experienced sponsors and higher-quality assets.
Construction lending remained historically subdued in 2H 2025, reinforcing growing concerns around future supply constraints.
Construction lending activity remained subdued in 2H 2025, despite a modest uptick in senior housing volumes during the third quarter. Senior housing construction loan volume rose to approximately $277 million in the third quarter, the strongest level since 2022, before declining again to roughly $143 million in the fourth quarter. Even with this temporary and small improvement, activity remained well below historical standards, highlighting the continued caution among lenders and developers toward new ground-up projects.
Nursing care construction lending remained extremely limited throughout the second half of the year. After recording only modest activity in 3Q, volumes returned to virtually nonexistent levels in 4Q, continuing the long-standing trend of minimal new development in the sector.
More broadly, the structural supply story remained largely unchanged in 2H 2025. The number of senior housing units under construction continued to hover near historic lows, while extended development timelines and elevated project costs continued to constrain new starts. The industry continues to face an increasing risk of insufficient future supply, while in some markets, inventory is no longer simply growing more slowly, it is beginning to contract.
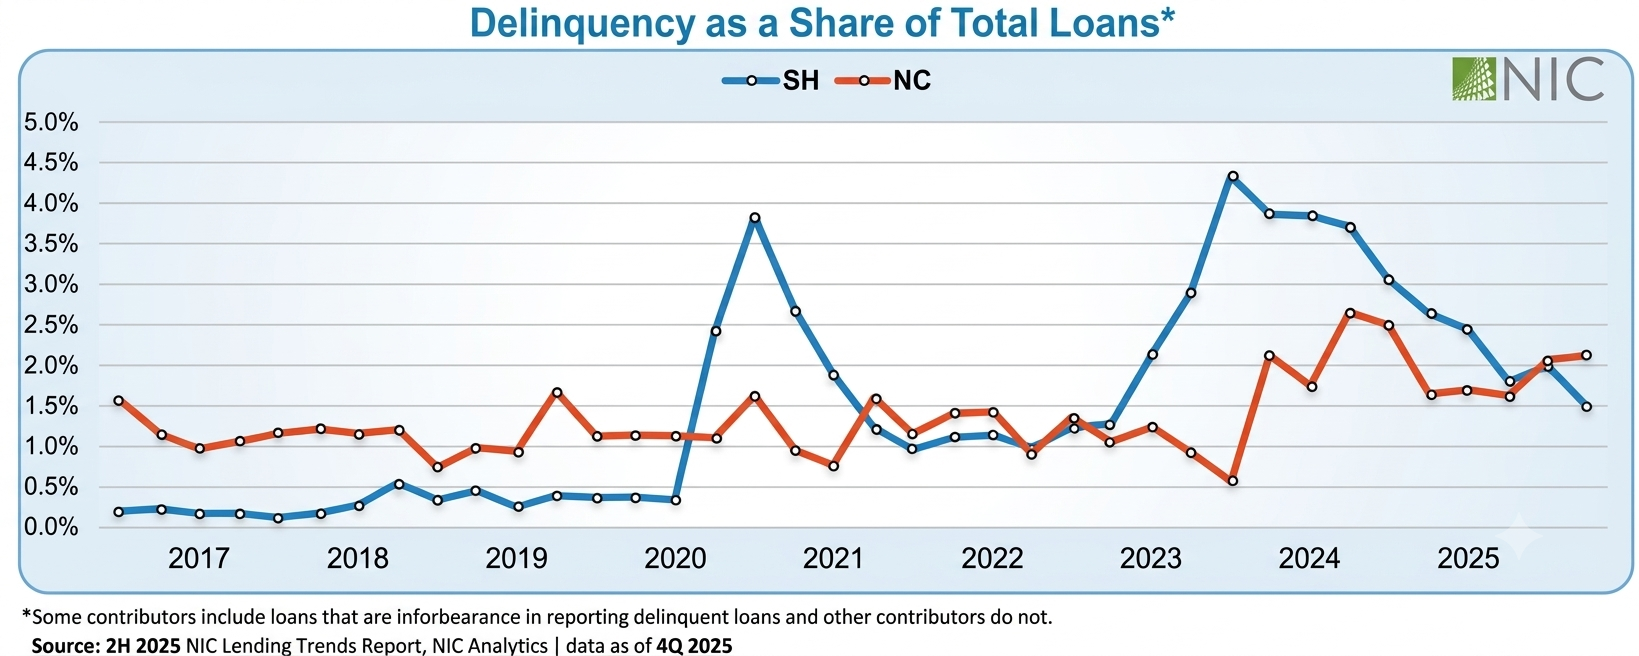
Delinquency rates remained relatively stable in 2H 2025, with senior housing improving further while nursing care held near recent highs.
Delinquency trends remained relatively stable in 2H 2025, particularly in senior housing, where overall credit performance continued to improve despite some quarter-to-quarter volatility in delinquent loan balances. Senior housing delinquencies represented 2.0% of total loans in the third quarter before declining further to 1.5% in the fourth quarter, continuing the sector’s broader recovery from the 2023 peak of 4.3%. (Note: loans in forbearance are included in the delinquent loan data for some debt providers, slightly influencing these figures.)
In nursing care, delinquency rates remained more elevated relative to senior housing, holding at 2.1% in both 3Q and 4Q. Persistent operating pressures, reimbursement challenges, and labor costs continued to weigh more heavily on skilled nursing operators, although overall credit conditions remained considerably more stable than in prior years.
Foreclosure activity for the sample in 2H 2025 totaled approximately $74.7 million for senior housing and $13.2 million for nursing care, highlighting that while credit performance has improved, pockets of financial stress and asset-level distress remain.
Download the complimentary 2H 2025 NIC Lending Trends Report for full details on these and other trends in senior housing and skilled nursing lending.
Note: This data is not to be interpreted as a census of all senior housing and skilled nursing lending activity in the U.S. but rather reflect lending activity from participants included in the survey sample only.
The NIC Lending Trends Report for the first half of 2026 is scheduled for release in December 2026.
Interested in participating? The NIC Lending Trends Report helps NIC Analytics deliver on NIC’s mission to enable access and choice by further enhancing transparency of capital market trends in the senior housing and care sectors. We very much appreciate our data contributors. This report would not be possible without them.
If you would like to participate and contribute your data to future lending trends surveys, please contact us at analytics@nic.org. As a courtesy for providing data, data contributors receive this report before publication on the website. The information provided as part of the survey will be kept strictly confidential. Individual answers will be combined with all other responses. Data acquired from this survey will only be reported in the aggregate, and therefore, the resulting aggregated data will not be attributed to you or your company upon distribution.
We use cookies on our website to give you the most relevant experience by remembering your preferences and repeat visits. NIC's privacy policy can be viewed here. By clicking “Accept”, you consent to the use of ALL the cookies.
This website uses cookies to improve your experience while you navigate through the website. Out of these cookies, the cookies that are categorized as necessary are stored on your browser as they are essential for the working of basic functionalities of the website. We also use third-party cookies that help us analyze and understand how you use this website. These cookies will be stored in your browser only with your consent. You also have the option to opt-out of these cookies. But opting out of some of these cookies may have an effect on your browsing experience.
Necessary cookies are absolutely essential for the website to function properly. This category only includes cookies that ensures basic functionalities and security features of the website. These cookies do not store any personal information.
Functional cookies help to perform certain functionalities like sharing the content of the website on social media platforms, collect feedbacks, and other third-party features.
Performance cookies are used to understand and analyze the key performance indexes of the website which helps in delivering a better user experience for the visitors.
Analytical cookies are used to understand how visitors interact with the website. These cookies help provide information on metrics the number of visitors, bounce rate, traffic source, etc.
Advertisement cookies are used to provide visitors with relevant ads and marketing campaigns. These cookies track visitors across websites and collect information to provide customized ads.