Experts weigh in at 2022 NIC Spring Conference.
Rebuilding occupancy is a top priority for the senior living industry. But the old roadmaps to success don’t necessarily apply in the wake of the pandemic and quickly changing market conditions. The labor shortage and shifting consumer preferences only make the task to fill units that much harder.
Effective, new strategies to attract residents were detailed by industry and outside experts at the 2022 NIC Spring Conference. The panel discussion, “A Roadmap for Building Back Occupancy,” was followed by lively breakout groups for participants to share successes and brainstorm new ideas.
“Building back occupancy is key,” commented NIC President and CEO Brian Jurutka at the Spring Conference. He added that the session on occupancy was first on the three-day program, reflecting the importance of the topic and the Spring Conference theme of “A New Day.”
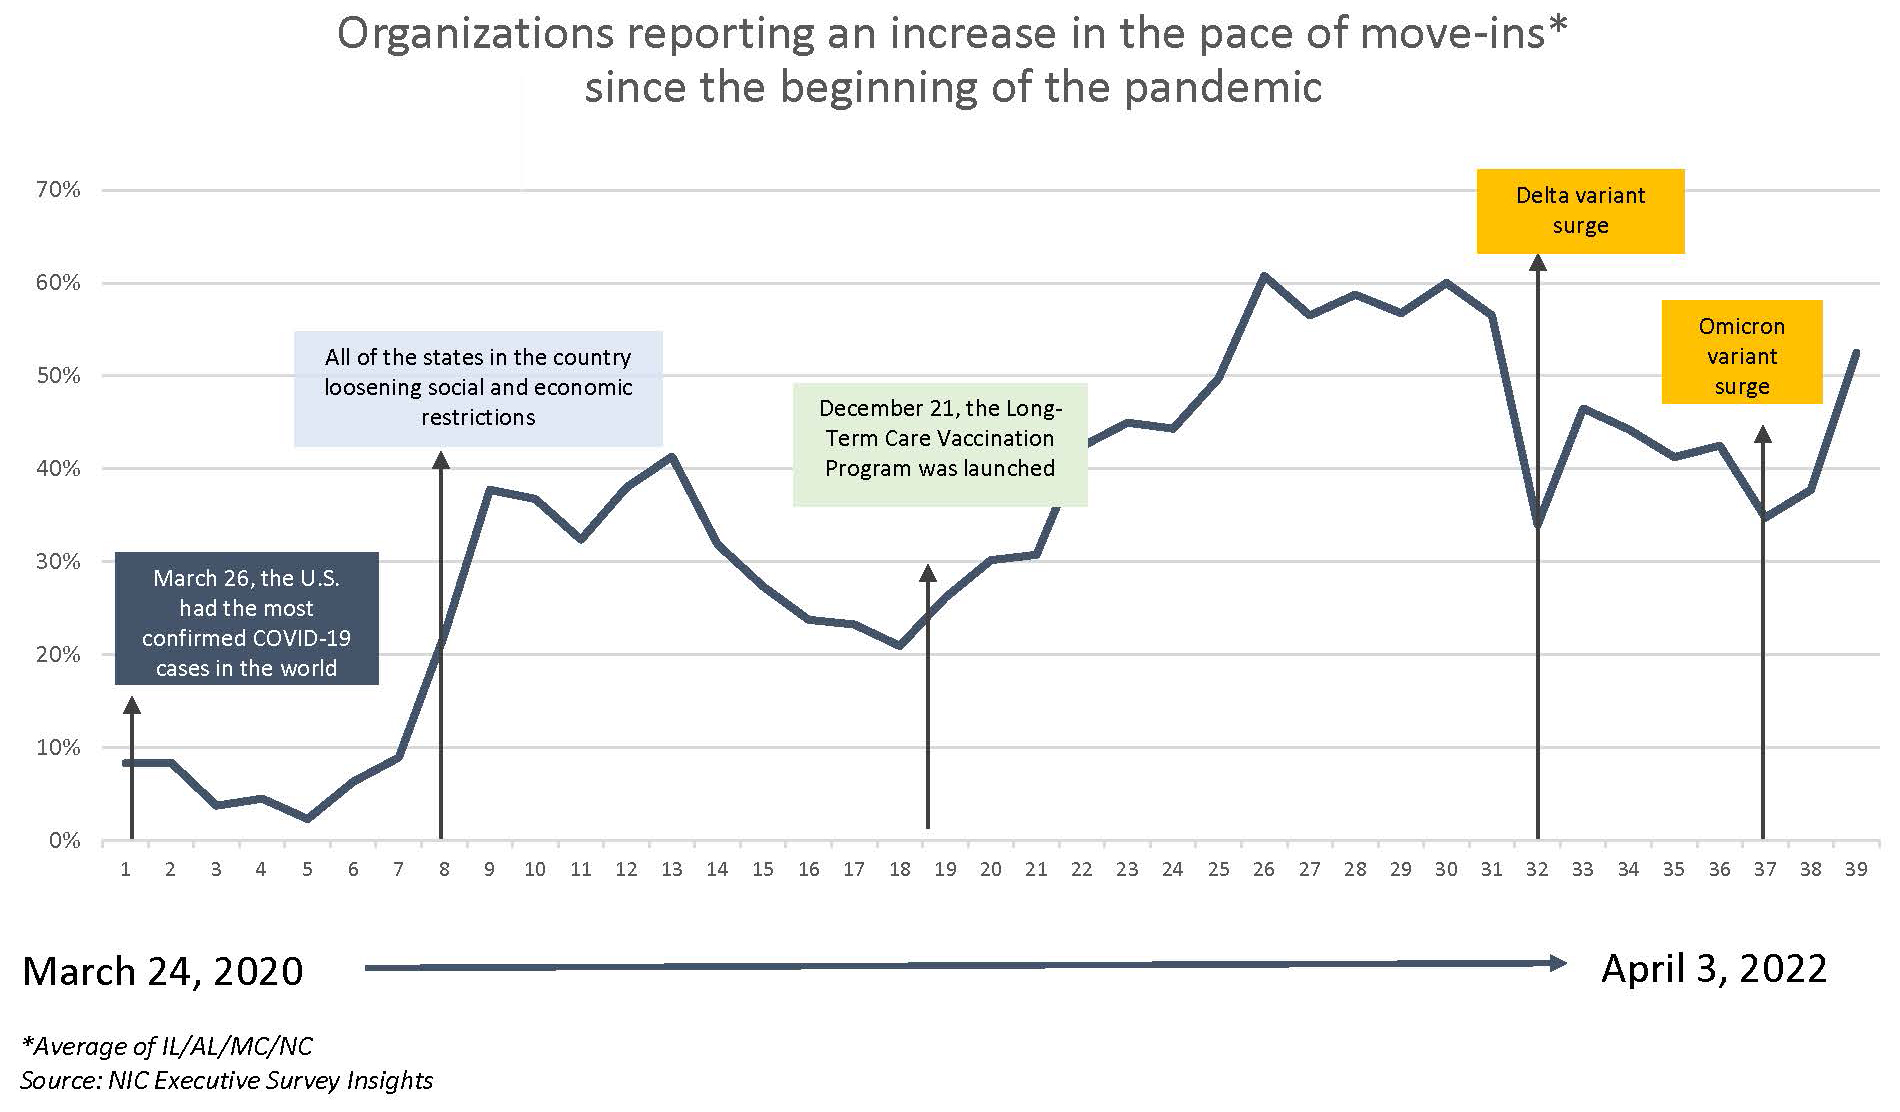
Putting the discussion in context, occupancy rates are improving despite the emergence of new COVID-19 variants. Senior housing occupancy increased to 80.6% in the first quarter of 2022 in the 31 NIC MAP® Primary Markets, a 0.2 percentage point increase from the fourth quarter of 2021 and a 2.5 percentage point increase from a pandemic-related low of 78.0% in the second quarter of 2021, according to NIC MAP data, powered by NIC MAP Vision. (The numbers were released in early April, after the Spring Conference.) This is the third consecutive quarter of increasing occupancy.
At the Conference, panel moderator and property appraiser Colleen Blumenthal, COO, HealthTrust, noted that occupancy rates vary widely. Coastal markets are faring better than inland markets. New supply in Atlanta and Dallas is filling quickly. Other markets without much new supply are still struggling. “Each market reacts differently,” she said.

Here are five ideas from the panelists on how to boost occupancy.
- Address changing consumer preferences. Panelist Derek Dunham, vice president at Varsity Branding said consumers have changed. They are well informed about senior housing. “They’ve done their research,” he said. They don’t want to focus on the pandemic but want to know how the community responded to the health emergency. But he added that consumers are making decisions faster because they’ve already done their homework. “They know what they want,” he said.
Adult children want to understand how mom and dad will be kept safe, according to panelist Courtney Siegel, president at Oakmont Senior Living. The company has opened 12 communities since 2020 and they are 90% occupied. Oakmont produced a new tool kit for on-site team members that provides healthcare resources for consumers. “We have to get the consumer comfortable to move into the building,” said Siegel.
- Strengthen referral networks. Demand for post-acute beds is growing at New Jersey-based Ocean Healthcare. “We have seen a turn back to pre-pandemic referrals from our acute-care partners,” said Joe Kiernan, chief strategy officer at Ocean Healthcare. Demand is also strong for the company’s home health services.
Metrics are crucial to boost post-acute occupancy. Providers must understand what measures their referral partners are looking for in value- based arrangements. “A big factor is lowering the hospital readmission rate,” said Kiernan. He added that population health departments drive referrals now more than social workers.
Oakmont tracks data such as falls, the use of psychotropics and outcomes on a daily basis to improve care. But metrics are not shared with consumers. “They’re looking for trust,” said Siegel. It’s more important how they feel about the relationships they have with the on-site team, “That gives them the confidence to move,” she said.
- Retool recruitment efforts. The tight labor market impacts occupancy. Some communities can’t take new residents because there’s not enough staff to care for them or process admissions. Ocean Healthcare launched its own staffing agency to stabilize staffing so it could grow occupancy. “We staffed our own buildings,” said Kiernan.
Other ideas to recruit and retain workers include higher pay, bonuses and flexible work schedules. Some communities in high income areas are adding workforce housing for their employees.
At Oakmont, talent recruitment is as important as consumer marketing, utilizing all communication channels, including social media, to reach potential employees. Another idea: Oakmont hired a full-time staff member to recruit applicants at job fairs at universities, colleges, and trade schools, generating dozens of applicants in difficult California markets. “It’s been very successful,” said Siegel. “We are full-time recruiters.”
- Reconfigure older buildings. Many older properties have small studio apartments. The obvious answer is to combine units though that’s not always possible, according to Dunham. Make sure the small units are professionally staged. “Let people see the possibilities,” he said. Target consumers on the lower end of the income scale with emails of floor plans of units that are immediately available. “They might not think they can afford to live there,” he said. Small units might also serve as workforce housing or guest suites.
Make sure online marketing campaigns match the available inventory. “Your marketing plan will evolve based on your vacancy,” said Siegel.
Ocean Healthcare grows through acquisition, including the purchase of older county nursing homes. Group rooms are reconfigured as private rooms. Larger spaces are dedicated to clinical programs. “We need to attract people,” said Kiernan, noting that hospitals are creating private rooms for patients that look like hotel suites.
- Improve tech offerings. Consumers expect robust wi-fi. The panelists also agreed that residents and families are looking for choice. A robust tech platform that allows the resident to order services or meals to-go can be a selling point. Zoom stations give residents an easy-to-use option to connect with family.

The session wrapped up with reports from the breakout groups. Some highlights: rate concessions don’t work and hurt long-term operating income; design needs-based housing more like a typical apartment building to make it feel like a discretionary choice to move in.
When will occupancy return to pre-pandemic levels? Kiernan thinks it will take 18-24 months though some regions will get there sooner. Siegel said it will depend on execution at the property level. Dunham added that some communities are having record years now.
Moderator Blumenthal emphasized the differences in markets. Some markets have already recovered; others will take a long time to reach pre-pandemic occupancy levels. Also, new residents are frailer than previous ones because they waited to move due to the pandemic. “Their length of stay may not be as long,” Blumenthal said, which could stretch out the refilling process. But in the effort to increase occupancy, stakeholders continue to explore a variety of new ideas.