Five Key Takeaways from NIC’s Fourth-Quarter 2017 Seniors Housing Data Release
NIC MAP® Data Service clients attended a webinar earlier this month on the key seniors housing data trends during the fourth quarter of 2017. Key takeaways included the following.
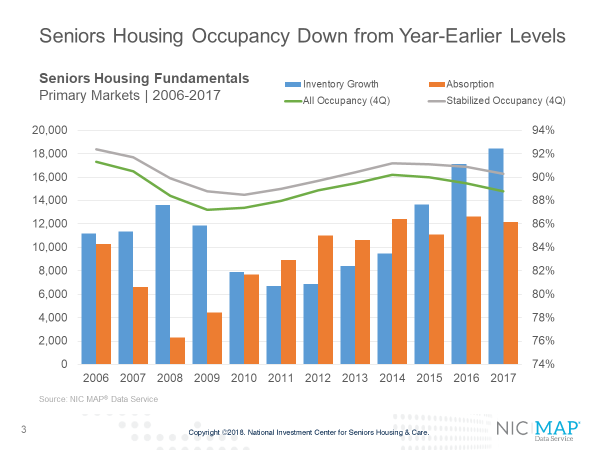
Takeaway #1: Seniors housing occupancy was unchanged at 88.8%
The all occupancy rate for seniors housing, which includes properties still in lease up, was 88.8% in the fourth quarter, unchanged from the third quarter. This placed occupancy 1.8 percentage points above its cyclical low of 87.0%, reached during the first quarter of 2010, and 1.4 percentage points below its most recent high of 90.2% in the fourth quarter of 2014. For the year, 18,500 units were added to inventory compared with 12,200 units absorbed on a net basis. As a result, occupancy fell 70 basis points from the fourth quarter of 2016.
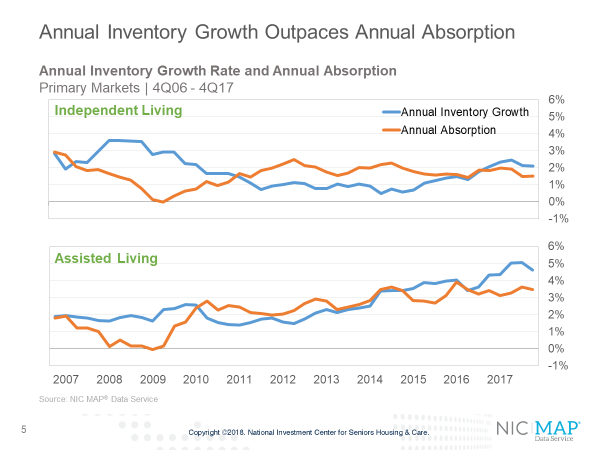
Takeaway #2: Annual inventory growth and annual absorption for both assisted living and independent living flattened during the quarter
Assisted living inventory growth has been ramping up for a longer period than independent living in the primary markets. In mid-2012, the occupancy rate of independent living was nearly the same as for assisted living at 88.8%. Since that time, there has been a clear divergence in occupancy performance reflecting the differences in supply growth and demand for the two property types.
For majority independent living properties, inventory growth exceeded absorption by 60 basis points in the fourth quarter—2.1% versus 1.5%. The occupancy rate for majority independent living properties was 90.6% in the fourth quarter. Annual inventory growth for majority assisted living properties was 4.6%, down a bit from the third quarter. Annual absorption slipped back to a pace of 3.6%. The occupancy rate for assisted living was 86.5% in the fourth quarter.
Key Takeaway #3: Nearly one-third of seniors housing inventory growth in past three years occurred in eight metropolitan markets
During the past three years, there have been nearly 79,000 units added to the stock of seniors housing inventory among the primary and secondary markets. Nearly one-third of this growth occurred in eight metro areas: Dallas, Minneapolis, Chicago Atlanta, Houston, Boston, Phoenix, and New York. Dallas alone accounted for 5% of all new seniors housing inventory in the past three years.
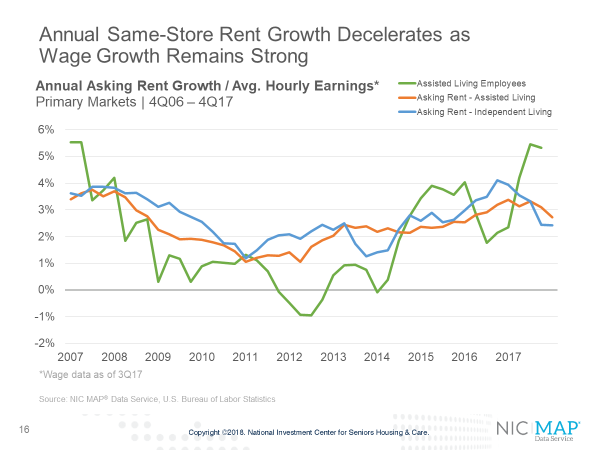
Key Takeaway #4: Same-store rent growth decelerated
Same-store asking rent growth for seniors housing slowed in the fourth quarter, with year-over-year growth of 2.6%. This was down from 3.7% in the fourth quarter of last year when it reached a cyclical peak, but was equal to its long-term average pace experienced since late 2006 of 2.6%.
Asking rent growth for majority assisted living properties was 2.7% in the fourth quarter, down 40 basis points from the third quarter. For majority independent living, rent growth remained at its third quarter pace of 2.4%, but was well below the 4.1% pace it achieved in the third quarter of 2016 when rent growth reached its highest pace since NIC began collecting this data.
There is wide variation in rent growth. Among the primary markets, the top ranked metropolitan areas for year-over-year rent growth in seniors housing were San Jose, Seattle, Los Angeles, Las Vegas and Portland, Oregon. The weakest rent growth was in Kansas City, Atlanta, Chicago and San Antonio. Many of these latter markets also had some of the lowest fourth quarter occupancy rates in the nation.
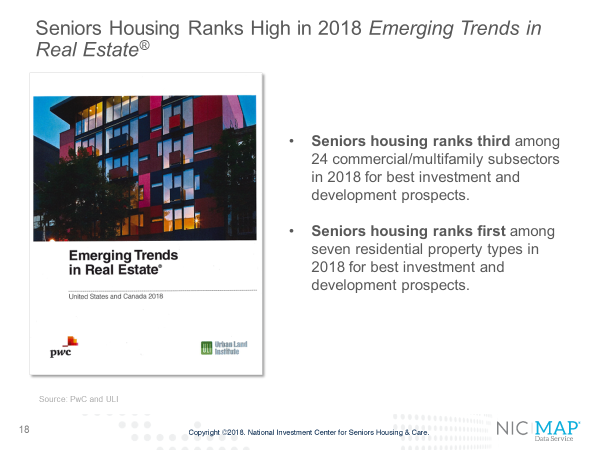
Key Takeaway #5: Seniors Housing Ranks High in 2018 Emerging Trends Real Estate ®
- Lastly, it’s notable that seniors housing is getting more attention from the investment community. In the recently released 2018 Emerging Trends in Real Estate®, produced jointly by PwC and the Urban Land Institute, seniors housing ranks high for best prospects in 2018 for both investment and development. According to the annual survey’s U.S. respondents, seniors housing ranked:
- Third among all 24 commercial and multifamily subsectors, and
- First among the 7 residential property types.
- The report further highlights the strength of seniors housings’ investment returns and its rising liquidity based on sales transactions volumes. These survey results bode well for continued interest among investors and developers in seniors housing properties going forward.