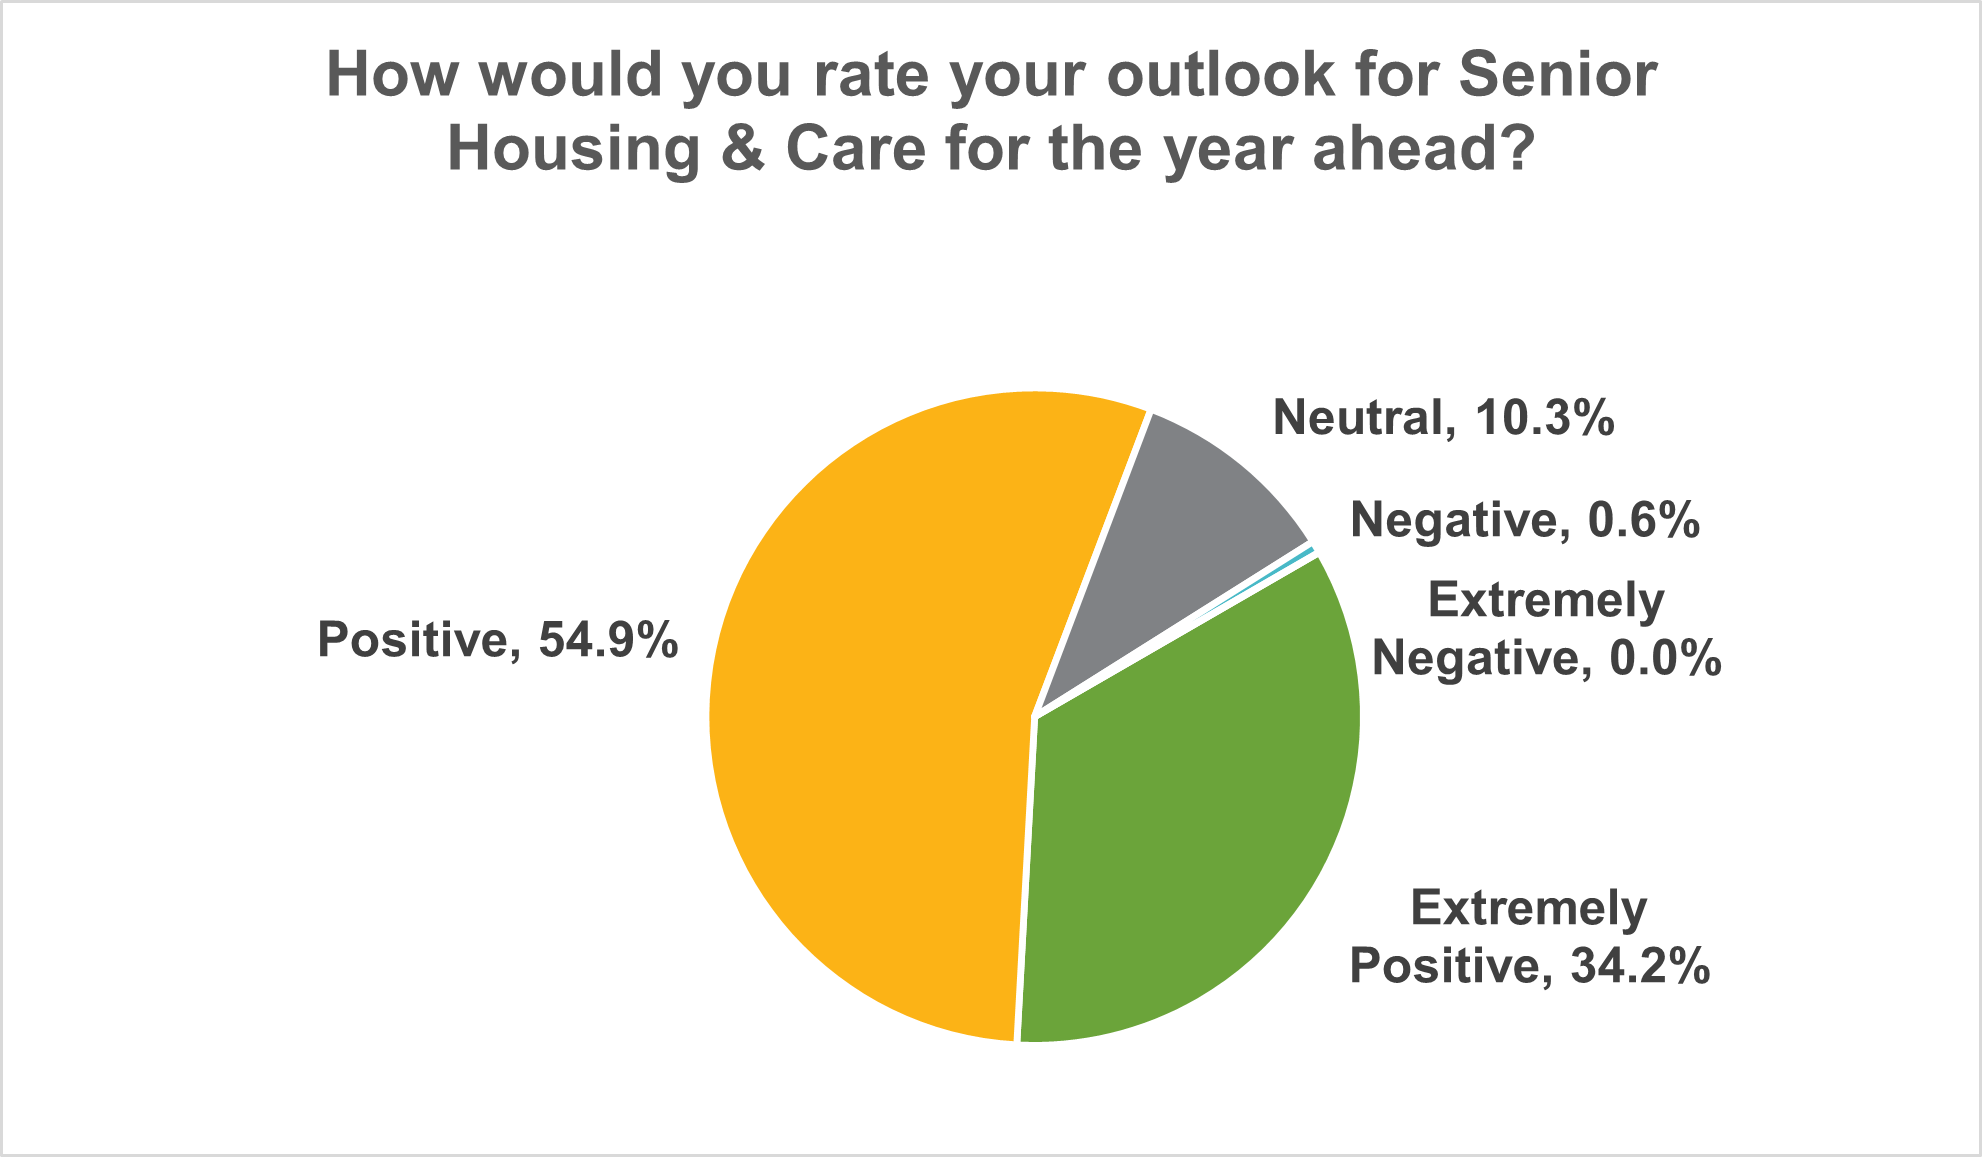
Nearly 2,100 attendees took part in the 2025 NIC Spring Conference in San Diego and the overall industry sentiment was overwhelmingly positive. Upon check-in, all attendees were asked to rate their outlook for the senior housing & care sector for the year ahead. As detailed in the chart below, nearly 90% responded “extremely positive” or “positive” and less than 1% shared a negative or extremely negative outlook.
Source: 2025 NIC Spring Conference, Industry Sentiment Poll (N=1,884)
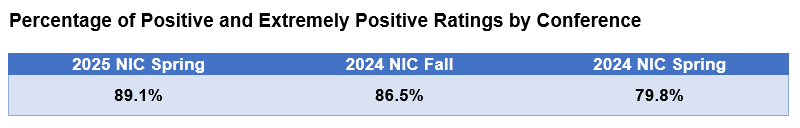
The sentiment from attendees is notably higher than one year ago and is also above what was measured at the 2024 NIC Fall Conference. The percentage of conference attendees with a positive outlook climbed by more than 9% across the past year.
Similar to other polls, there were differences across respondent type. The financial intermediaries in attendance at the conference had the most positive outlook, with 95% reporting a ‘positive’ or ‘extremely positive’ outlook for the year ahead. The lowest ratings came from healthcare providers. Roughly 85% of this group responding positively.
The NIC Research and Analytics team will continue to conduct the industry sentiment poll at upcoming conferences, including the 2025 NIC Fall Conference, September 8-10 in Austin, TX.
Senior Housing Pricing Strategies Diverge in Late 2024
Data from the recently released 4Q 2024 NIC MAP Actual Rates Report show that:
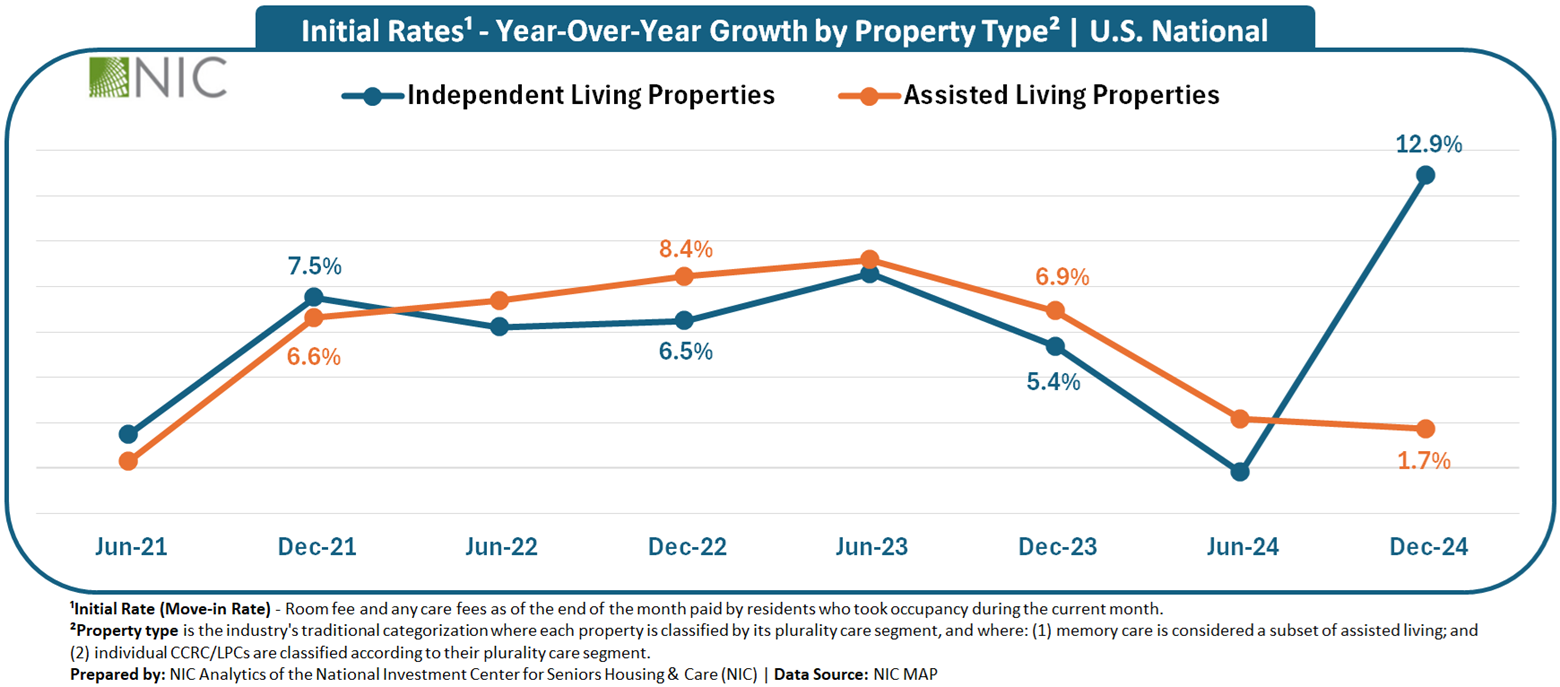
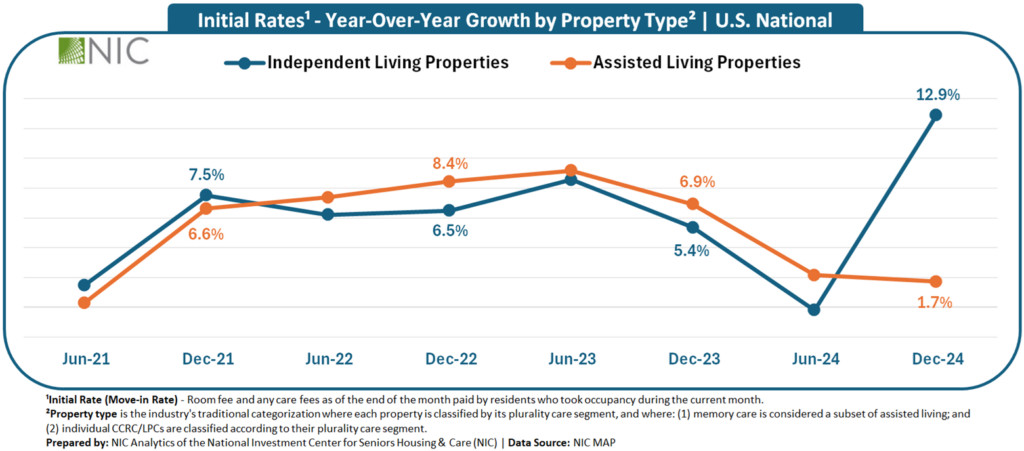
As 2024 ended, the senior housing market witnessed a notable shift in pricing dynamics between independent living (IL) and assisted living (AL) properties. Historically, initial rate growth in both property types moved nearly in tandem (see exhibit below), with operators adjusting pricing strategies in response to similar macroeconomic and demand trends. However, since mid-2024, a clear divergence emerged, with IL properties accelerating initial rate growth and reducing discounting, while AL properties experienced a slowdown in initial rate growth alongside increased discounting.
This shift marked a departure from previous years, when IL operators relied more heavily on discounting to drive lease-ups. Instead, December 2024 data reflected a market where pricing power returned to operators.
While move-ins continued to exceed move-outs in the fourth quarter of 2024 for both IL and AL properties, this break in historical alignment between IL and AL initial rate trends signals a change, and affordability likely played a role in shaping these new market dynamics, particularly in the need-based AL property type, where margin compression poses risks.
Going into 2025 and as care costs continue to rise, price sensitivity in AL is increasing, leading operators to recognize that IL and AL require distinct pricing strategies. IL properties can capitalize on rate elasticity due to their choice-based nature, while AL operators need to navigate the affordability equation strategically to maintain occupancy growth momentum while preserving financial health.
Independent Living Properties: Strong Pricing Momentum and Reduced Discounting
Year-over-year growth in initial rates for independent living properties continued to set new time-series highs in the fourth quarter of 2024, building on the record growth seen in the previous quarter. Initial rates surged 12.9% year-over-year in December 2024, more than doubling the 5.4% increase seen in December 2023. Operators also reduced discounts, with initial rates averaging 5.5% ($238) below asking rates in December 2024, compared to 8.9% ($359) in December 2023. This equated to a 0.7-month discount on an annualized basis, down from 1.1 months the previous year.
Assisted Living Properties: Slower Rate Growth and Widening Discounts
In December 2024, initial rates grew just 1.7% year-over-year, down sharply from 6.9% in December 2023. Unlike IL, discounting in AL widened, with initial rates averaging 8.6% ($567) below asking rates, compared to 6.4% ($402) in December 2023. This resulted in a 1.0-month discount in December 2024, up from 0.8 months the previous year.
Additional key takeaways are available to NIC MAP subscribers in the full report.
About the Report
The NIC MAP Seniors Housing Actual Rates Report provides aggregate national data from approximately 300,000 units within more than 2,700 properties across the U.S. operated by 35 to 40 senior housing providers. The operators included in the current sample tend to be larger, professionally managed, and investment-grade operators as a requirement for participation is restricted to operators who manage 5 or more properties. Visit the NIC MAP website for more information.
CCRC Performance 4Q 2024: Entrance Fee vs. Rental
The following analysis examines broader occupancy trends, year-over-year changes in inventory, and same-store asking rent growth – by care segment – within 571 entrance fee CCRCs and 488 rental CCRCs in the 99 NIC MAP Primary and Secondary Markets.
Entrance Fee CCRCs Lead in Occupancy Rates
Entrance Fee CCRCs Maintained a Higher Occupancy Rate than Rental CCRCs in the Fourth Quarter of 2024. In the 99 NIC MAP Primary and Secondary markets, the occupancy rate for entrance fee CCRCs increased to 91.3%, 3.2 percentage points (pps) higher than rental CCRCs (88.1%) and 5.5pps higher than non-CCRCs (85.8%). In the fourth quarter of 2023, the occupancy rate surpassed 90% and has continued to grow quarter over quarter since.
Rental CCRCs Reported Higher Year-over-year Occupancy Growth than Entrance Fee CCRCs in the Fourth Quarter of 2024. Compared to year-earlier levels, rental CCRC occupancy has increased by 2.1pps while entrance fee CCRCs saw a growth in occupancy rate of 1.1pps.
The occupancy rate of rental CCRCs reached 78.9% in the second quarter of 2021 and has increased for 14 consecutive quarters since, with a cumulative growth of 9.2pps. This increase is more than double the 4.1pps growth seen in entrance fee CCRCs over the same period.
4Q 2024 Market Fundamentals by Care Segment – Entrance Fee CCRCs vs. Rental CCRCs
The exhibit below compares the market performance of entrance fee CCRCs and rental CCRCs by care segment for the fourth quarter of 2024, highlighting year-over-year changes in occupancy, inventory, and asking rent growth.
Occupancy. Entrance fee CCRCs continued to outpace rental CCRCs in occupancy rate across all care segments. The difference in the fourth quarter of 2024 occupancy rates between entrance fee CCRCs and rental CCRCs was largest in the independent living segment (3.0pps), followed by the nursing care segment (1.1pps), and the assisted living segment (1.0pps), with the smallest gap in the memory care segment (0.8pps).
The highest occupancy in entrance fee CCRCs was seen in the independent living care segment (92.7%), while the memory care segment (89.8%) has the highest occupancy rate in rental CCRCs.
Asking Rent. The monthly average asking rent for entrance fee CCRCs across all care segments remained higher than rental CCRCs. Rental CCRCs showed higher year-over-year rent growth in assisted living (4.9% to $6,179), memory care (5.0% to $7,874), and nursing care (4.6% to $395) segments.
Note, these figures are for asking rates and do not consider any discount that may occur.
Inventory. Compared to year-earlier levels, independent living inventory experienced the largest decline in rental CCRCs (2.5%) and the largest growth in entrance fee CCRCs (0.5%). For rental CCRCs, the memory care segment saw the largest year-over-year inventory growth at 1.4%. This is the only positive year-over-year inventory growth among all care segments.
Negative inventory growth can occur when units/beds are temporarily or permanently taken offline or converted to another care segment, outweighing added inventory.
Look for future articles from NIC to delve into the performance of CCRCs.
Senior Housing 2024 Total Return of 3.6% Outperforms Broader NCREIF Property Index by 3.1 Percentage Points
Senior housing posted a positive total return of 2.07% in the fourth quarter of 2024, bringing full year 2024 total returns to 3.64%, the third highest NCREIF property type return for the year after hotel (+6.59%) and retail (+5.33%). Senior housing outperformed the broader Expanded NCREIF Property Index (NPI) in both the quarter and year, which posted a total return of 0.94% and 0.59%, respectively. Senior housing capital appreciation in the fourth quarter turned positive for the first time since mid-2022, increasing 0.77%. The capital appreciation return is the change in value net of any capital expenditures incurred during the quarter. Senior housing income in the fourth quarter was also positive, yielding 1.31%. For the broader NPI in the fourth quarter, property valuations continued to move lower (capital appreciation of -0.24%), partially offsetting the positive income return of 1.17%.
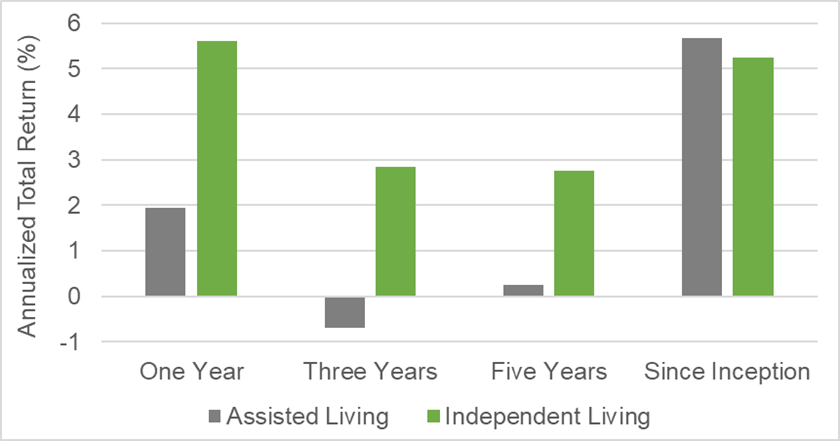
By senior housing property subtype, both independent living (+2.73%) and assisted living (+1.51%) posted positive total returns in the fourth quarter. For the full year 2024, independent living returned 5.60% while assisted living returned 1.95%. In recent years, independent living has also outperformed assisted living over the three- and five-year periods. This outperformance may be driven by higher margins typically generated in lower acuity settings such as independent living, which require less staffing and labor expenses than higher acuity settings such as assisted living. Additionally, independent living has had higher occupancy rates during this period. Over the longer run, since NCREIF began tracking returns data for these subtypes roughly a decade ago, both assisted living and independent living posted similar returns averaging more than 5% annually.
Annualized Total Returns by NCREIF Property Subtype As of 12/31/2024; Unlevered
Note: Since Inception is 2014 for Assisted Living and 2016 for Independent Living Source: NCREIF, 4Q 2024, Unlevered Annualized Total Returns
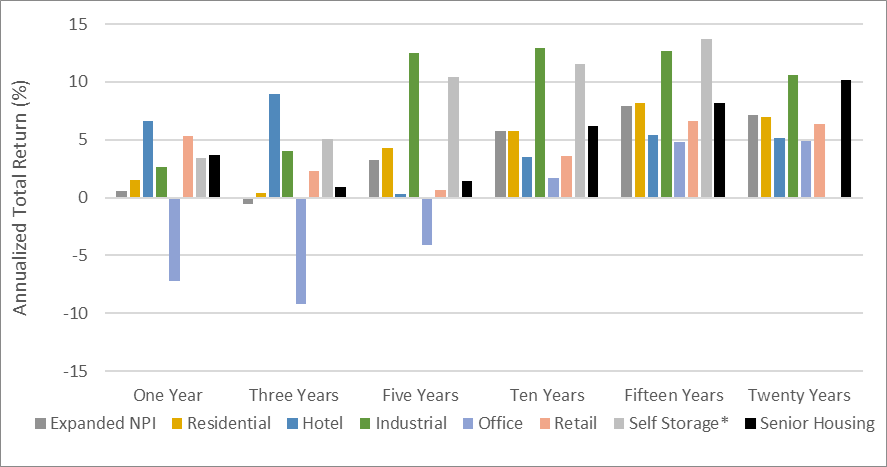
Compared to other NCREIF property types over the 10-, 15-, and 20-year periods, senior housing was the strongest property type except for industrial and self-storage, outperforming the NPI on an annualized basis by 39, 26, and 302 basis points, respectively. Since the 2003 beginning of NCREIF’s senior housing historical time series, income yield drove roughly 60% of senior housing total returns, while price appreciation contributed roughly 40%. These performance measurements reflect the returns of 225 senior housing properties valued at $11.72 billion in the fourth quarter. Overall, the number of senior housing properties tracked within the NPI has grown significantly from the 56 properties initially tracked in 2003.
Annualized Total Returns by NCREIF Property Type As of 12/31/2024; Unlevered
* Self Storage does not yet have 20-year historical performance Source: NCREIF, 4Q 2024, Unlevered Annualized Total Returns
Senior housing market fundamentals remained positive in 2024, with the occupancy rate for the 31 NIC MAP Primary Markets increasing 0.7 percentage points to 87.2% in the fourth quarter, gaining 2.2 percentage points from a year earlier. By property type in the fourth quarter, there was a 0.7 percentage point increase in the independent living occupancy rate and a 0.6 percentage point increase in the assisted living occupancy rate, and both gained more than 2.0 percentage points in occupancy for the full year 2024.
Occupancy increases were driven by another year of robust demand as 2024 net absorption was roughly in line with 2022 and 2023 levels. Inventory growth in 2024 was slightly higher than 2023 but overall remained low and near levels last seen roughly a decade ago. Looking ahead, given the current supply and demand trends, NIC forecasts that occupancy levels will surpass 90% by the end of 2026, which has only happened a handful of other times since NIC MAP began tracking the data.
Senior Housing Capital Markets 2025 Update
After nearly five years of uncertainty and headwinds in the seniors housing space, capital markets going into 2025 seem to come with the headline “Cautiously Optimistic”.
Over the past 18-24 months, in particular, unprecedented interest rate and cap rate pressure sidelined sponsors and capital providers, leading many in the industry to adopt a “wait-and-see” approach. Additionally, regulatory pressures on federally regulated financial institutions caused permanent financing refinance options to essentially vanish and banks to reduce new loan originations and adopt a more rigid approach to existing loan modifications and maturities, likely requiring additional cash collateral, loan curtailments, recourse, and increased loan pricing. All these factors created additional stress on senior housing assets, regardless of performance and cash-flow at the asset level.
However, as 2025 begins, the tides seem to be turning (albeit, more slowly than desired). The fourth quarter of 2024 saw declining interest rates for the first time in years, and asset values have been rebounding, providing some much-needed marginal relief – and hope – across the industry.
2025 will be interesting on many levels, with particular attention paid to inflation and interest rates. From an interest rate perspective, with the presidential election behind us, and so much policy uncertainty as we enter 2025, it is possible – and even likely – that the Fed will pause rate cuts at the January Federal Open Market Committee (FOMC) meeting, with the expectation there will be fewer cuts than previously thought in 2025. Despite this, interest rate stability is a welcomed change from the rising rate environment we have all been living in.
With stable interest rates and asset values, coupled with the increasingly strong fundamentals of the industry, capital markets seem to be slowly and selectively reentering the space. From banks who have been able to recognize payoffs and are now able to deploy new loan dollars, to new equity groups and debt funds entering the space (or even reentering after sitting out the past few years), liquidity for new and existing inventory appears to be rising.
With that, an additional consideration is how new and existing inventory will continue to be capitalized throughout 2025. For existing inventory, traditional bank debt is increasingly available for assets with positive leasing momentum that need some additional time, while a rising number of debt funds are showing interest and available capital for assets with a different story wherein recapitalization or repositioning is needed. On the other side of the coin, new inventory is a rarity as annual inventory growth has been declining since 2019, and currently sits at approximately 1% as of 3Q24 NIC Map Data. However, for sponsors with patient and recurrent equity, along with efficiencies of development, banks are interested and willing to extend new loan dollars after experiencing payoffs throughout the latter half of 2024.
Regardless of what is to come in 2025, the ability to rely on patient and flexible partnerships between sponsors and capital providers continues to be a vital resource.
We use cookies on our website to give you the most relevant experience by remembering your preferences and repeat visits. NIC's privacy policy can be viewed here. By clicking “Accept”, you consent to the use of ALL the cookies.
This website uses cookies to improve your experience while you navigate through the website. Out of these cookies, the cookies that are categorized as necessary are stored on your browser as they are essential for the working of basic functionalities of the website. We also use third-party cookies that help us analyze and understand how you use this website. These cookies will be stored in your browser only with your consent. You also have the option to opt-out of these cookies. But opting out of some of these cookies may have an effect on your browsing experience.
Necessary cookies are absolutely essential for the website to function properly. This category only includes cookies that ensures basic functionalities and security features of the website. These cookies do not store any personal information.
Functional cookies help to perform certain functionalities like sharing the content of the website on social media platforms, collect feedbacks, and other third-party features.
Performance cookies are used to understand and analyze the key performance indexes of the website which helps in delivering a better user experience for the visitors.
Analytical cookies are used to understand how visitors interact with the website. These cookies help provide information on metrics the number of visitors, bounce rate, traffic source, etc.
Advertisement cookies are used to provide visitors with relevant ads and marketing campaigns. These cookies track visitors across websites and collect information to provide customized ads.