As the leading data provider for the seniors housing and care industry, the NIC MAP Data Service® tracks occupancy, asking rents, demand, inventory and construction data for independent living, assisted living, memory care, skilled nursing and continuing care retirement communities (CCRCs), also referred to as life plan communities, for more than 15,000 properties across 140 metropolitan areas. NIC MAP® currently tracks 1,196 nonprofit and for-profit entrance fee and rental CCRCs in these 140 combined markets (1,125 in the 99 combined Primary and Secondary Markets).
CCRCs offer multiple care segments (at a minimum independent living and nursing care) typically by a single provider on one campus. This analysis breaks the care segment types apart from the CCRC community type that NIC includes under the main category of Seniors Housing. Care segment type refers to each part or section of a property that provides a specific level of service, i.e., independent living, assisted living, memory care or nursing care.
Expanding on a recent NIC blog post that detailed 3Q 2019 CCRC market fundamentals data and trends in the 99 combined Primary and Secondary markets, which represent the aggregate of the data collected from 99 of the nation’s largest core-based statistical areas (CBSAs), the following analysis examines current inventory, occupancy, year-over-year same store asking rent growth—and average occupancy growth, average annual same store asking rent growth, and average change in inventory for the past three years—by care segments within CCRCs (CCRC segments) compared to non-CCRC segments in freestanding or combined communities to focus a lens on the relative performance of care segments within CCRCs.
Key Findings:
CCRCs reported higher occupancy and rent growth than non-CCRCs, which had significantly higher levels of inventory growth. Higher inventory growth at non-CCRCs, lower turnover at CCRCs, CCRC customer characteristics (e.g., “planners who are attracted to lifestyle-enriched amenities and services with the security of knowing future healthcare needs will be met) and the relative performance of the majority unit mix may explain potential reasons for these stronger rates of occupancy in CCRCs.
- As of 3Q 2019 in the 99 Primary and Secondary Markets, the overall occupancy rate at CCRCs was 5.0 percentage points higher than at non-CCRCs (91.4% vs. 86.4%). And, between 3Q 2016 and 3Q 2019, care segment occupancy improved more for CCRCs than non-CCRCs.
- The current occupancy rate for both CCRCs and non-CCRCs was highest in the independent living care segment (92.7% and 88.4%); occupancy was lowest for CCRCs in the nursing care segment (88.7%)—and for non-CCRCs in the memory care segment (83.7%).
- The difference in current occupancy between CCRCs and non-CCRCs was the highest for the memory care segment (7.6 percentage points), followed by the assisted living care segment (6.1 percentage points), the independent living care segment (4.2 percentage points) and the nursing care segment (2.8 percentage points).
- For the three-year time period under study (3Q 2016 to 3Q 2019), CCRCs had higher rates of occupancy growth than non-CCRCs for each of the four care segments.
- The memory care segment at CCRCs reported the highest occupancy growth (2.3 percentage points). The least growth in occupancy was noted for the non-CCRC independent living and assisted living care segments (declining 3.0 and 2.6 percentage points, respectively).
- Inventory growth (reported as the change in the number of units from 3Q 2016 to 3Q 2019) was higher for non-CCRCs across all of the four care segments.
- Both CCRCs and non-CCRCs reported the largest (proportionate) inventory growth for the time period in the memory care segment.
- Only the nursing care segment reported negative inventory growth (CCRCs -2.3% and non-CCRCs -1.1%). Reasons for negative inventory growth may include some beds being taken offline, combined, or shifted to lower acuity care segments.
- From 3Q 2016 to 3Q 2019, the highest average year-over-year same store asking rent growth was noted for CCRCs in the independent living and assisted living care segments (3.4% and 3.3%), and the lowest for non-CCRCs in the independent living care segment 2.1% (which, incidentally, also had the largest negative average change in occupancy for the three-year period under study, -3.0 percentage points).
Current Unit Mix and Occupancy
In the third quarter of 2019, CCRC occupancy, which is inclusive of both entrance fee and rental payment types in both nonprofit and for-profit communities across the 99 Primary and Secondary Markets, was 91.4%–equal to the highest occupancy rate achieved since 4Q 2008. Non-CCRC occupancy averaged 86.4% in 3Q 2019 (5.0 percentage points lower than CCRC occupancy).
Conventional wisdom suggests that the wide discrepancy in occupancy rates may be due, in part, to the unique CCRC product offering, which tends to attract retirees who are “planners”—those who wish to make one move to a continuum of care—or perhaps because new CCRC residents are generally healthier than residents in other types of seniors housing, resulting in lower resident turnover in CCRCs.
However, another potential reason for the difference in occupancy rates may be a result of the relative influence of the majority inventory mix in CCRCs compared to non-CCRC communities (freestanding and combined). As shown in the chart, in aggregate, CCRCs are comprised of a majority of independent living care segment units (55.5%), followed by nursing care units (27.1%), assisted living units (13.8%), and memory care units (3.7%). Compared to CCRCs, non-CCRCs have lower proportions of independent living care segment units (14.2%), higher proportions of nursing care units (53.3%), assisted living units (24.2%) and memory care units (8.3%) than CCRCs.
Thus, the overall CCRC occupancy rate, compared to the overall non-CCRC occupancy rate, may be influenced positively by majority unit mix as the CCRC independent living care segment (which represents 55.5% of CCRC units) garnered the highest occupancy in the third quarter of 2019 (92.7%), as well as on average for the three-year period under study. The current nursing care segment occupancy rate in non-CCRCs, which represents 53.3% of non-CCRC units, was much lower at 86.0%.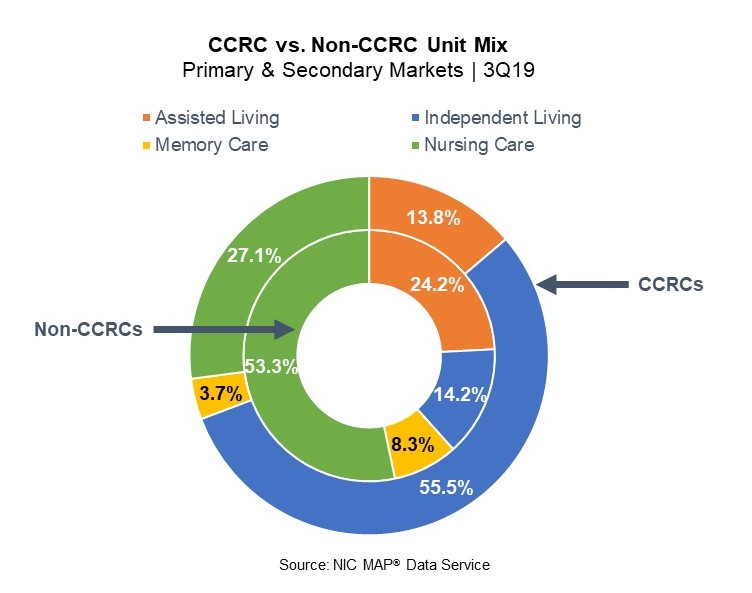
CCRCs vs. Non-CCRCs in Detail
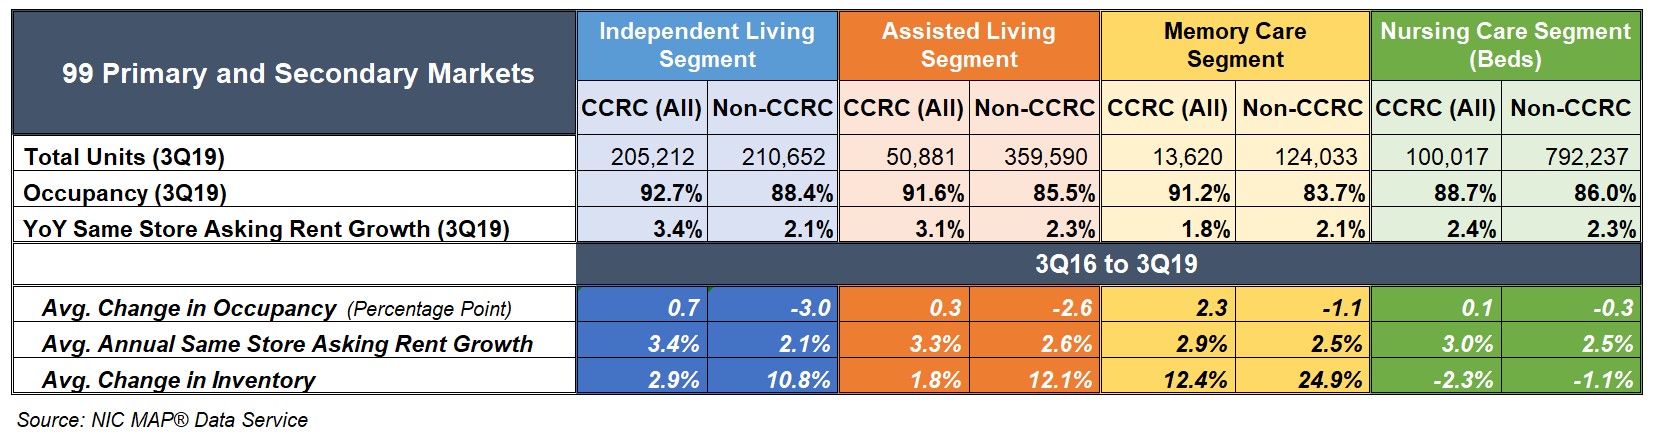
The table below compares each of the care segments—independent living, assisted living, memory care and nursing care—in the 99 Primary and Secondary Markets. The table shows the 3Q 2019 total open units, occupancy and year-over-year same store asking rent growth—and average change in occupancy, average year-over-year same store asking rent growth, and average change in inventory for CCRCs and non-CCRCs for the three-year time period (3Q 2016 to 3Q 2019).
The CCRC independent living care segment had the highest 3Q 2019 occupancy (92.7%), followed by assisted living (91.6%), memory care (91.2%), and nursing care (88.7%). Among non-CCRCs, the independent living care segment had the highest 3Q 2019 occupancy (88.4%), followed by nursing care (86.0%), assisted living (85.5%) and memory care (83.7%).
The difference in 3Q 2019 occupancy between CCRCs and non-CCRCs was the highest for the memory care segment (7.6 percentage points), followed by the assisted living care segment (6.1 percentage points), the independent living care segment (4.2 percentage points) and the nursing care segment (2.8 percentage points).
CCRC same store year-over-year asking rent growth in the third quarter of 2019 was 3.9% (down from the time series high of 4.6% reached in the first quarter of 2019). The highest year-over-year same store asking rent growth was reported for CCRCs in the independent living and assisted living care segments (3.4% and 3.1%). The lowest was noted for CCRCs in the memory care segment (1.8%), and non-CCRCs in the independent living and memory care segments (2.1%, respectively).
Higher Occupancy at CCRCs
For the three-year time period under study, CCRCs had positive improvement in occupancy rates for all four care segments, while non-CCRC care segments saw declines in occupancy. The best improvement in occupancy was for the CCRC memory care segment (2.3 percentage points), and the largest occupancy declines were for the non-CCRC independent living and assisted living care segments (-3.0 and -2.6 percentage points).
- Among CCRCs, the memory care segment had the strongest occupancy improvement (a gain of 2.3 percentage points), followed by independent living (a gain of 0.7 percentage points), assisted living (a gain of 0.3 percentage points), and the nursing care segment (a gain of 0.1 percentage points).
- Among non-CCRCs, the independent living care segment had the greatest change in occupancy and this change was negative (a decline of 3.0 percentage points), followed by assisted living (a decline of 2.6 percentage points), memory care (a decline of 1.1 percentage points), and the nursing care segment (a decline of 0.3 percentage points).
Significantly Weaker Inventory Growth at CCRCs
For the three-year time period under study, non-CCRCs had significantly higher rates of inventory growth (change in inventory), overall, and by segment, than CCRCs. Between 3Q 2016 and 3Q 2019, inventory at CCRCs grew by 1.6% (5,892 units), while non-CCRC inventory growth grew by 5.6% (75,775 units). The highest rate of inventory growth was reported for both CCRCs and non-CCRCs in the memory care segment (12.4% and 24.9%); the lowest was reported for both CCRCs and non-CCRCs in the nursing care segment (-2.3% and -1.1%).
- Among CCRCs, the memory care segment had the highest inventory growth (12.4%–a gain of 1,507 units), followed by independent living (2.9%–a gain of 5,867 units), and assisted living (1.8%–a gain of 895 units). However, inventory declined in the nursing care segment by 2.3% (a reduction of 2,377 beds).
- Among non-CCRCs, the memory care segment had the highest inventory growth (24.9%–a gain of 24,752 units), followed by assisted living (12.1%–a gain of 38,904 units), and independent living (10.8%–a gain of 20,562 units). Inventory declined in the nursing care segment by 1.1% (a reduction of 8,443 beds).
Higher Annual, Same Store Asking Rent Growth at CCRCs
For the three-year time period under study, CCRCs had higher rates of average year-over-year asking rent growth overall, and by segment, than non-CCRCs. The highest was noted for CCRCs in the independent living and assisted living care segments (3.4% and 3.3%), and the lowest for non-CCRCs in the independent living care segment 2.1%.
- Among CCRCs, the independent living care segment had the highest average year-over-year same store asking rent growth for the three-year period (3.4%), followed by assisted living (3.3%), nursing care (3.0%), and the memory care segment (2.9%).
- Among non-CCRCs, the assisted living care segment had the highest average year-over-year same store asking rent growth over the three-year period (2.6%), followed by the memory care and nursing care segments (2.5%, respectively), and the independent living care segment (2.1%).
Look for future blog posts from NIC to delve deep into the performance of CCRCs. For further information on NIC, its reports, and data and analytics services available to providers, please visit the NIC website at www.nic.org.
A version of this analysis was originally posted to Ziegler’s Z-News newsletter on December 13, 2019.