Senior housing posted a positive total return of 2.08% in the second quarter of 2025, bringing year-to-date returns to 4.00%, the highest NCREIF property type return for the first half of the year.
Senior housing in the second quarter outperformed the broader Expanded NCREIF Property Index (NPI) by 85 basis points, with the index posting a total return of 1.23%. Senior housing capital appreciation in the second quarter was positive with valuations increasing 0.72%. The capital appreciation return is the change in value net of any capital expenditures incurred during the quarter. Senior housing income return in the second quarter was also positive, yielding 1.36%. For the broader NPI in the second quarter, both capital appreciation (+0.04%) and income yield (+1.19%) were also positive.
By senior housing property subtype, independent living (+2.15%) outperformed assisted living (+1.99%) in the second quarter. In recent years, independent living has also outperformed assisted living over the one-, three-, and five-year periods. This outperformance may be driven by higher margins typically generated in lower acuity settings such as independent living, which require less staffing and labor expenses than higher acuity settings such as assisted living. Additionally, independent living has had higher occupancy rates during this period. Over the longer run, since NCREIF began tracking returns data for these subtypes roughly a decade ago, both assisted living and independent living posted similar returns averaging more than 5.5% annually.
As of 6/30/2025; Unlevered
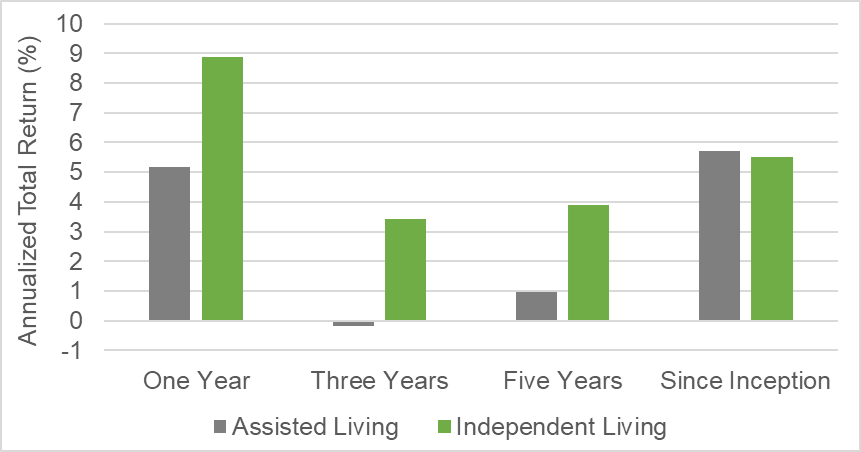
Source: NCREIF, 2Q 2025, Unlevered Annualized Total Returns
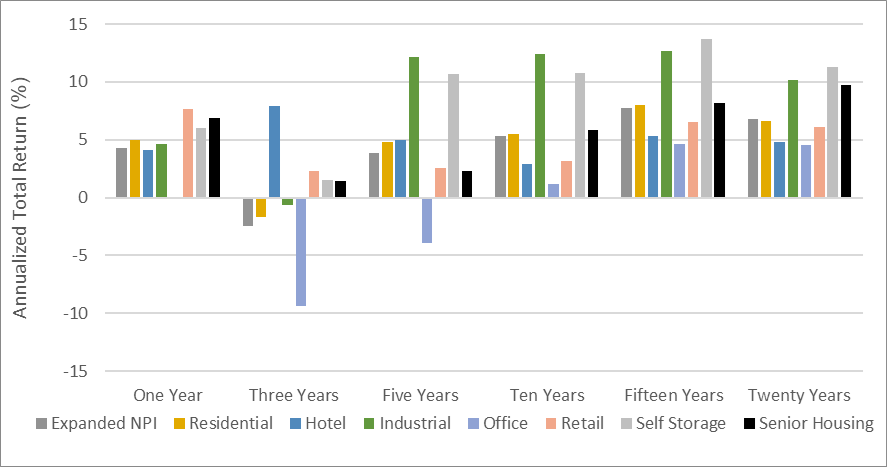
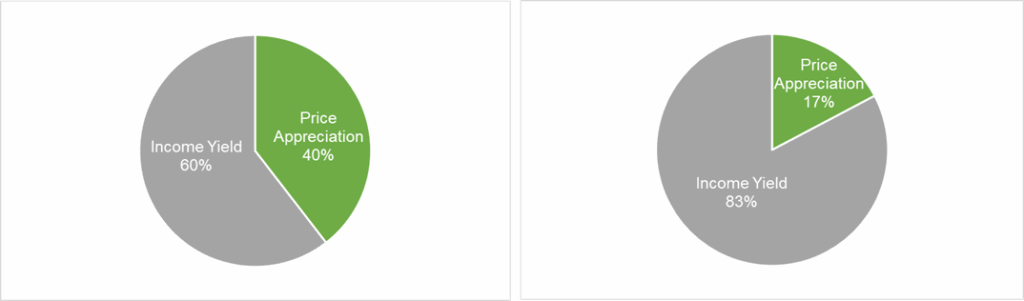
Compared to other NCREIF property types over the 10-, 15-, and 20-year periods, senior housing was the strongest property type except for industrial and self-storage, outperforming the NPI on an annualized basis by 52, 41, and 297 basis points, respectively. Since the 2003 inception of NCREIF’s senior housing historical series, income yield drove roughly 60% of senior housing total returns, while price appreciation contributed roughly 40%. These performance measures reflect the returns of 211 senior housing properties valued at $12.38 billion in the second quarter. Overall, the number of senior housing properties tracked within the NPI has grown significantly from the 56 properties initially tracked in 2003.
As of 6/30/2025; Unlevered
As of 6/30/2025; Unlevered
Senior housing market fundamentals remained positive in the second quarter, with the occupancy rate for the 31 NIC MAP Primary Markets increasing 0.8 percentage points to 88.1%, driven by net absorption of senior housing units outpacing the number of new units arriving online. Occupied units reached another record high in the second quarter, while year-over-year inventory growth fell below 1.0% for the first time since NIC MAP began tracking this data in 2006. By property type, occupancy rates for independent living have made slightly higher gains in recent quarters than assisted living, which is a reversal of trends in 2022 and 2023. In the second quarter, independent living increased to an average occupancy rate of 89.7%, while assisted living increased to 86.4%.
| TOTAL RETURN | ||||
|---|---|---|---|---|
| NCREIF Property Index (NPI) | Senior Housing | Assisted Living | Independent Living | |
| 2Q 2025 | 1.23 | 2.08 | 1.99 | 2.15 |
| YTD | 2.51 | 4.00 | 3.27 | 4.79 |
| One Year | 4.31 | 6.91 | 5.17 | 8.87 |
| Three Years | -2.49 | 1.44 | -0.19 | 3.41 |
| Five Years | 3.83 | 2.29 | 0.98 | 3.89 |
| Ten Years | 5.31 | 5.83 | 5.28 | N/A |
| Fifteen Years | 7.77 | 8.18 | N/A | N/A |
| Twenty Years | 6.78 | 9.75 | N/A | N/A |
| INCOME | ||||
| NCREIF Property Index (NPI) | Senior Housing | Assisted Living | Independent Living | |
| 2Q 2025 | 1.19 | 1.36 | 1.39 | 1.34 |
| YTD | 2.38 | 2.72 | 2.74 | 2.72 |
| One Year | 4.81 | 5.26 | 5.11 | 5.45 |
| Three Years | 4.47 | 4.47 | 4.05 | 4.99 |
| Five Years | 4.35 | 4.06 | 3.63 | 4.59 |
| Ten Years | 4.51 | 4.79 | 4.63 | N/A |
| Fifteen Years | 4.94 | 5.50 | N/A | N/A |
| Twenty Years | 5.20 | 5.96 | N/A | N/A |
| APPRECIATION | ||||
| NCREIF Property Index (NPI) | Senior Housing | Assisted Living | Independent Living | |
| 2Q 2025 | 0.04 | 0.72 | 0.59 | 0.81 |
| YTD | 0.13 | 1.26 | 0.52 | 2.04 |
| One Year | -0.48 | 1.59 | 0.07 | 3.28 |
| Three Years | -6.73 | -2.93 | -4.11 | -1.52 |
| Five Years | -0.51 | -1.71 | -2.58 | -0.68 |
| Ten Years | 0.77 | 1.00 | 0.63 | N/A |
| Fifteen Years | 2.74 | 2.59 | N/A | N/A |
| Twenty Years | 1.53 | 3.65 | N/A | N/A |
Source: NCREIF, 2Q 2025, Unlevered Annualized Total Returns