As demand for senior housing continues to climb, NIC has added additional expertise to the leadership guiding its work. As of July 1, 2026, NIC has added four new voices to its board and confirmed its officer slate for the 2026–2027 term, a lineup that reflects NIC’s ongoing engagement with industry leaders to help advance access and choice for older adults.
NIC’s board chair, Ken Segarnick, principal at KCS Growth Partners, LLC, put it well: “This is an exciting moment for NIC, and for the senior housing and care sector. We are adding extraordinary talent to our board — individuals who have not only shaped their corners of the industry, but who have already demonstrated their dedication to NIC’s work through years of active involvement. I am energized by what this team will accomplish together, and I am committed to building on the strong foundation we have as we work to advance quality and innovation while expanding access and choice for older adults.”
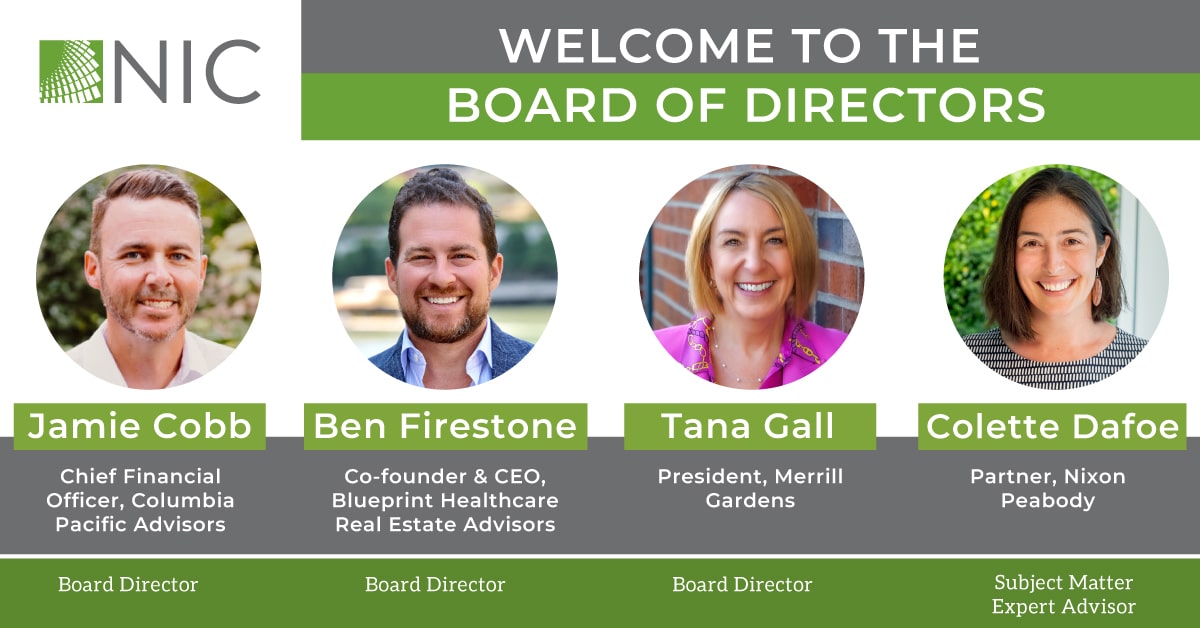
Meet the New Board Members
Jamie Cobb, CFO of Columbia Pacific Advisors, joins NIC with deep financial expertise. He’s been a fixture on the Spring Conference Program Committee for years, contributing to timely and relevant content that educates the industry on where things are headed.
Ben Firestone, CEO & Co-Founder of Blueprint Healthcare Real Estate Advisors, is one of NIC’s own success stories — a graduate of NIC’s Future Leaders Council (FLC) and former member of the Fall Conference Program Committee. His work in senior housing capital markets and transactions makes him a natural fit for the board.
Tana Gall, President of Merrill Gardens, brings the operator’s perspective to the table. She is a longstanding NIC volunteer who currently co-chairs the Fall Conference Program Committee and serves as vice chair of the Operator Advisory Board.
NIC’s Newest Advisor
Colette Dafoe, Partner at Nixon Peabody LLP, joins the board in an advisory capacity as a subject matter expert. Dafoe is an FLC alumna and currently chairs the FLC Advisory Committee, bringing legal expertise alongside her long-standing involvement in NIC’s leadership development activities.
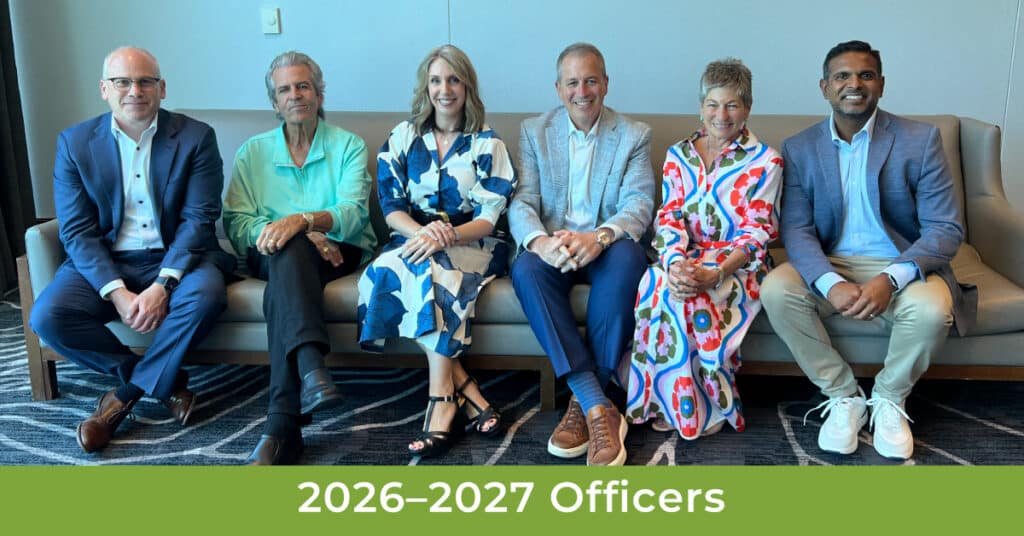
NIC’s 2026–2027 Officers
- Board Chair: Ken Segarnick, Principal, KCS Growth Partners, LLC
- Vice Chair: John Rijos, Co-founder/Operating Partner, Chicago Pacific Founders & Founder/Chairman, CPF Living Communities
- Second Vice Chair: Lynne Katzmann, Founder & CEO, Juniper Communities
- Secretary: Bre Grubbs, Chief Strategy Officer, Leisure Care
- Treasurer: Matt Ruark, Senior Vice President, KeyBank
- Assistant Treasurer: Vikas Gupta, Chief Investment Officer, Omega Healthcare Investors, Inc.
With Gratitude to Outgoing Leadership
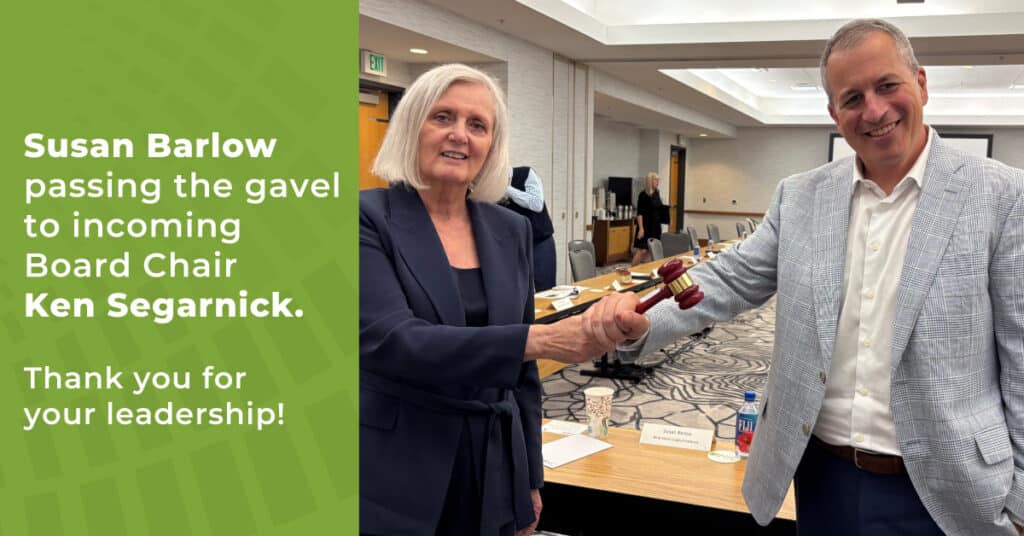
NIC extends its sincere thanks to immediate past board chair Susan Barlow, whose leadership guided the organization over the last three years. Barlow will remain on the board, continuing to lend her experience going forward.
NIC is equally grateful to the three directors who have rolled off the board: Jack Callison, Imran Javaid, and Mercedes Kerr. Their contributions and dedication over the course of their service have helped shape NIC’s direction and strengthen its mission.
Volunteers who dedicate their time and talent to NIC’s board, committees, and advisory groups contribute directly to NIC’s mission at a pivotal time — investor interest in senior housing remains strong, and the need for more options for older adults has never been more urgent.