In “Dramatic Moments in History: Another Period of Disruption,” Kurt Read, Chair of Board of Directors, NIC; and Principal, RSF Partners; provided attendees of the 2020 NIC Fall Conference with a review of the seniors housing and care industry’s performance characteristics since NIC was founded in 1991. This is the second of a series of three NIC Notes posts that provide the key takeaways from that session which reviewed the past 30 years of investment in seniors housing and care.

Development Cycles
Another way to look at the past 30 years, is to see how this relatively new industry has development cycles, driven by the need to meet growing demand. Read analyzed three distinct cycles, which have occurred since 1991. During the savings and loan boom, cash flowed into real estate. Seniors housing developed at more than double the pace of preceding years. While the boom created oversupply, it also fueled entrepreneurial efforts to improve seniors housing models and products.
Read recalled a meeting with Bill Colson and Norm Brenden, in 1991, just as the crisis hit, and capital was fleeing the sector. Their company, Holiday Retirement, was looking for capital. “Oh my goodness, did they have a great product. They had consumers, during this time period, during a recession, moving into their properties…they were developing at a 90% occupancy to a 15% unlevered return on cost.” Although other investors “beat us to the punch” on the opportunity, he pointed to this as an example of how, “During a period of disruption, if you have a great product that can earn a really good return for the risk, you’re going to raise capital.” He pointed out that other great companies in the space, such as Sunrise Senior Living and Erickson Living, were able to access capital in the late ‘80’s and early ‘90s, launching their rise, even amid a major disruption in the space.
During the IPO boom of the mid ‘90s, capital was again flooding into the sector. Read recalled hearing IPO pitches for “newfangled” assisted living properties. “When they got to the part about their growth plans, I could tell this was not going to end well.” Companies were planning to open new properties at an unrealistic pace, and the result, according to Read, was, “too many properties, being built too quickly, in too few markets. We had a huge overhang from that.” As was the case in the previous crisis, new supply fell off dramatically as a result.
Going into the Great Financial Crisis, there was less supply growth. “That was part of the story for why we had such great performance, relative to other real estate asset classes,” explained Read. New inventory volumes dropped again in 2010-2012. “That set us up for a wonderful period of outperformance. We had better returns than other asset classes. We had demand growth. Capital was available, and here we go – another development boom.” As more new properties came on the market, through the end of the decade, occupancy rates grew, then flattened, then softened on a national basis. Despite record demand, absorption couldn’t keep up with the burgeoning supply.
Buying Low
Looking at all three of the economic crises outlined in our first NIC Notes post, Read observed three distinct opportunities to buy quality properties at lower prices. “You put periods of disruption together with a highly cyclical development flow and money flow into our space, and what you get are some really interesting opportunities.” In the savings and loan crisis, many opportunities existed to buy quality assets at low prices. Read’s company acquired a public company, the Forum Group, with “wonderful Class A assets, 26 of them, they had just been built during the easy money times. They were a creation of a firm you may have heard of: Drexel Burnham Lambert.” That company, run by the now infamous Michael Milken, had over–financed the senior living company which had developed most of its properties. “Financing new development with current pay junk bonds was not a recipe for success.” Recapitalized, the properties were able to get through the recession. “It was a very successful investment for us,” said Read.
The healthcare real estate crisis also produced buying opportunities, generated by oversupply and a disrupted revenue model in skilled nursing. As C-corps and REITs suffered low occupancy rates, missed lease-up targets, and, simultaneously, skilled nursing operators began to miss lease payments, investors saw opportunities to buy stocks, bonds, bank debt, assets, and companies. As in the former crisis, development fell off significantly. In that environment, many companies were able to acquire assets at low prices and achieve great success. “It was a terrific time to be buying brand new, disrupted private-pay senior housing. Some of the best institutional investors made really great use of this time period and developed incredible track records as savvy purchasers, owners, and managers of senior living assets at this time.”
Keep Your Eye on Capital Flows
During the broad financial disruption of the Great Financial Crisis, the senior living industry looked very strong, relative to other real estate asset classes. “The healthcare REIT sector of public REITs was the largest sector by market cap during this time. Bigger than malls, bigger than office buildings, because we were doing so well relative to the other real estate asset classes. This really set up a period of outperformance for our industry. We had demand growth, we had reasonable supply/demand balance, we had good returns, we didn’t suffer during the GFC. Wow, this looked like a great place for people to rotate their capital to, and indeed they did.”
According to Read, “the takeaway from this is, keep your eye on capital flows into our industry. It’s really a small industry relative to other real estate asset classes. When you see that supply curve bending up and to the right, you’ve got to put your radar up, because we’ve had big cycles in this space. If you think about it, we’re a real estate sector, we’re a healthcare sector, and we’re a hospitality sector. You put those three things together and there are more chances for disruption over a long period of time than there are for a more simple asset class, like industrial, to pick one.”
Be Patient
Looking at the NCREIF market value index over all three recessions, Read illustrated how much time it took to recover from each. Investors affected by the savings and loan crises didn’t gain back the value lost until eleven years later. He pointed out it also took 4-5 years to hit bottom. “You’ve got to be patient,” he said, “it was not a good idea to be wandering into the U.S. real estate market, buying a bunch of real estate in the first couple of years of the savings and loan crisis…you had to wait until you got to 1992 before you could plow in.” The Great Financial Crisis, despite sharp declines, took two years to bottom out. “You hear pontificators talk about a “V” shaped recovery, ‘we’ll be back by Christmas’, all this nonsense, that’s not how real estate works,” said Read, “any crisis that affects real estate takes a while.”
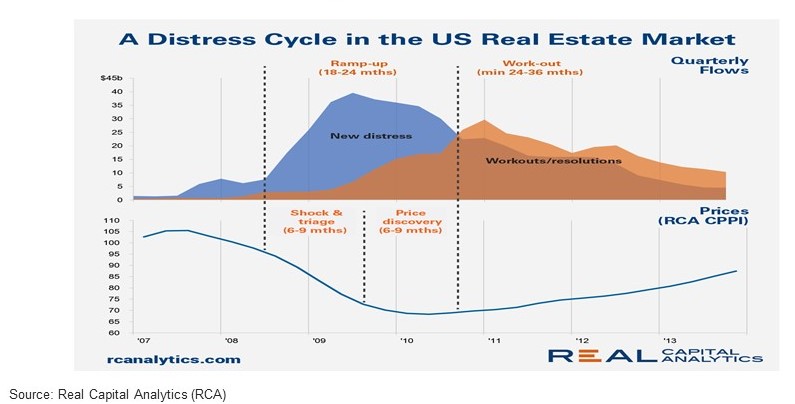
To further illustrate that point, Read examined distress cycles, revealing the lengthy process, from “shock and triage,” through a “price discovery” period, and then workouts and resolutions via distressed property transactions. “It takes time,” Read summarized, “It’s complicated and slow.”