Last week, the United States claimed the top spot in known coronavirus cases. States across the country are issuing guidelines to stay at home; an increasing number are mandating a social distancing strategy with shelter in place orders. Seniors housing operators are cancelling all non-essential group activities and events. Essential activities like meals are being staggered to minimize contact with multiple staff members and other residents.
The consensus is COVID-19 is most dangerous for older adults – particularly those with underlying health conditions, who are at the greatest risk of succumbing to the illness that the virus causes. For many of the frailest in our nation’s skilled nursing properties, human touch, familiar faces, and family are critical to their well-being and serve as an antidote to loneliness and depression.
Maintaining the health of this population means taking extra precautions to keep their distance from others and closely heeding the advice of medical professionals to simply stay home. As for visitors, who are usually considered a health benefit by seniors housing and care properties, the safest policy unfortunately must now be a no-visitation policy. While the new restrictions can be difficult for both residents and their families, they are necessary to ensure the health and safety of communities and the frontline staff who serve them.
How do we ensure that at this critical time, the very important act of social distancing doesn’t result in adverse mental health effects? The key is realizing that physical separation does not unequivocally translate to loneliness. Being alone and being lonely are two very different things. Fortunately, there are a lot of creative ideas being put into practice. Every day I read of innovative solutions, as operators, staff, vendors, and activity directors find creative new approaches to enabling social interaction even at a time when physical distancing is required. There are plenty of examples of socialization being maintained while safe distancing practices are being observed.
Despite aggressive infection control procedures curtailing group activities and social meals, there are still a great number of opportunities for seniors to connect with family, friends, and loved ones during these turbulent times. For some operators, this highly infectious coronavirus has highlighted an opportunity to use technology in seniors housing and care communities to maintain and expand the sense of connections that people have. Others focused on the number of seemingly solitary activities that can provide a sense of purpose, improve mental health, and maintain a sense of connectedness. Here are a few examples of what some communities and the vendors who support them are doing to maintain physical isolation while avoiding the feeling of being socially isolated.
Maintaining a Digital Connection
For families looking to stay updated on their loved ones’ care, software maker SafeKeeping has begun providing its Family Communicator platform to all senior care facilities in the U.S. and Canada – free of charge. Providers who manage resident records with PointClickCare can now give never-before-seen insights to residents’ families. Families can access patient care records, exchange messages with staff, and be notified of major events through secure SMS text and email.
Parker Jewish Institute for Health Care and Rehabilitation has been making personal calls to family members to share information on the status of residents. Recently, the Family Call Center was implemented to simplify the process. Employees from Parker’s Admissions Department and Social Adult Day Health Program were rerouted to staff the new resource, which is assisting with both non-emergent matters and connecting family members through virtual technology.
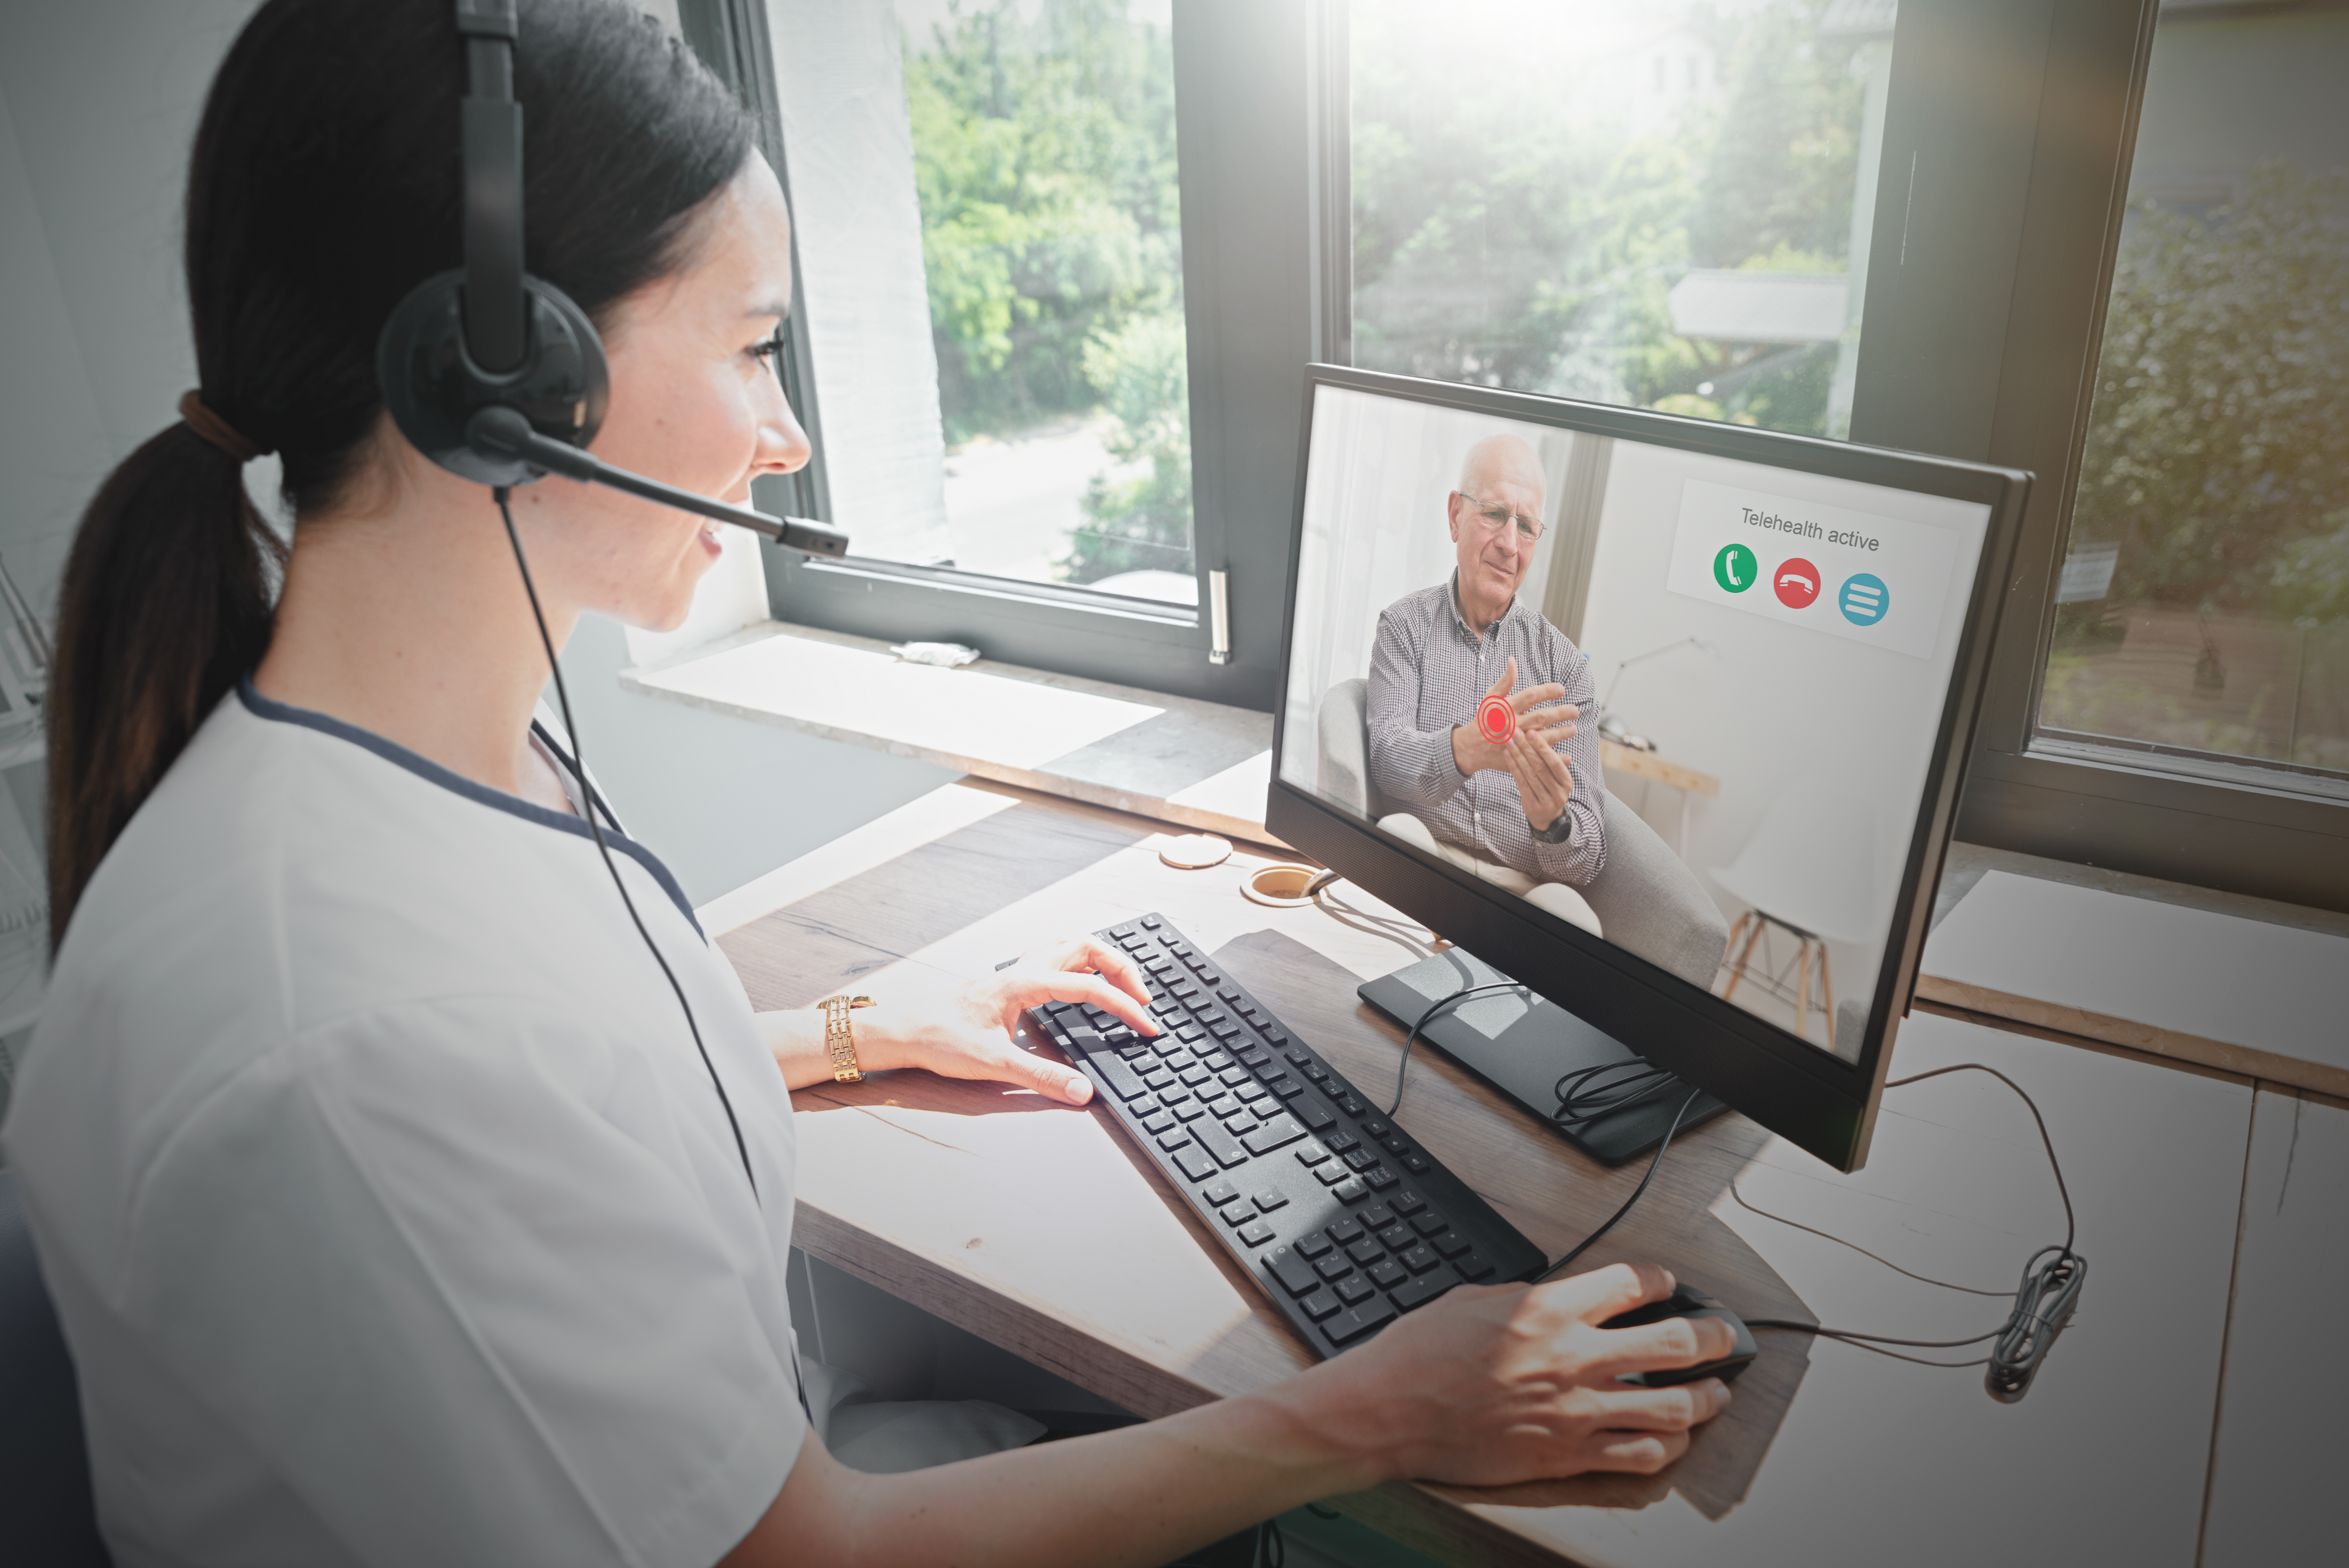
Staff members of seniors housing and care properties are now increasingly walking family members through the process of accessing technology so they can visit virtually with friends and loved ones. Platforms like Zoom, Discord, and Houseparty provide video-enabled social networking, allowing residents to spend time with people that they care about, bringing them together despite their physical distancing. In many cases, these communication tools are being used between residents and staff as well, as communication that doesn’t require staff to be physically present in the room is safest for all parties involved. While nothing replaces the touch of a loved one, being able to see a smile, blow a kiss, or read a story together can go a long way to ensure that feelings of loneliness are kept to a minimum.
Improved In-Room Interactive Programming
Visitor restrictions for seniors housing and skilled nursing communities are now approaching their fourth week, and if the growth in U.S. confirmed cases is any indication, are not likely to be lifted anytime in the near future. Activity directors – or purpose matchmakers as I like to call them – have been finding ways to bring interactive programming directly to the rooms of residents. Activities once meant to physically bring residents together are now being offered through the residents’ TV sets with Entertain 360’s MessageNOW software. Instead of cancelling religious services and interactive games, these are now being broadcast directly to residents’ rooms over a dedicated channel. Residents must continue engaging in activities and conversations that enable them to feel connected rather than isolated.
For family members looking to keep residents up to date on their activities, how tall the grandson is getting, or how they are managing their own homebound time, web-connected, digital photo frames are an easy solution. Nixplay picture frames allow for a cloud-based photo to be sent directly to the frame without the need for publication to a wider audience, as is often the case on Facebook or Instagram. These digital picture frames offer one more way to help maintain a sense of mental well-being during this challenging time.
Eversound has been improving well-being in assisted living and memory care communities by enhancing their ability to focus and engage in group events and one-on-one interactions. Their live-streamed interactive programming gives residents the power to connect, discover, and learn from the comfort of their own couch. Eversound recently opened the archives of past live-streamed events and is providing them at no cost through the end of April. Included in the archives being made available are art classes, concert series, food and cocktail hours, history lessons, and science classes.
These examples are just a few of the many tools that are now available to help improve in-room programming. Many of these vendors are joining the likes of Never Too Late and being viewed truly as partners to providers, communities, and their residents. In collaboration with operators, they are addressing real needs, and overcoming concerns of social isolation by helping to keep residents engaged in this crisis.
Upholding Mind and Body Health
Residents at The Landings of Mills River have been brushing up on their art skills, having decided to create stained-glass style art on the windows throughout their community for those driving by. They have also been encouraging photo shoots with staff and residents alike. According to Executive Director Joy Elliot, this new program is producing by far the most photos ever taken at the Landings. Perhaps one silver lining is that staff have discovered a program well worth continuing long after the crisis has passed.
Understanding that it is vital for residents to stay active and engaged, many seniors housing operators are also encouraging gardening for their residents. Gardening has been linked with better recovery following surgery, lower rates of anxiety and depression, as well as better stress management. In addition to the rewards of witnessing a cultivation grow, the practice can prove to be beneficial for residents’ physical and mental health. If the thought of starting a garden seems daunting, with safety restrictions in place, consider something as simple as having a few potted plants or herbs on a table or windowsill. These can give a sense of purpose to the resident while practicing safe distancing. Their growth can result in a sense of pride, accomplishment, and responsibility.
As the above examples have shown, physically isolated seniors do not have to feel as though they have become socially isolated. Providers, vendors, staff, and residents are finding creative ways to ensure that physical separation does not translate to social isolation and feelings of loneliness. Vendors implementing solutions to improve social connection in these difficult times are positioning themselves truly as partners to the seniors housing and care communities, because being alone does not unequivocally mean being lonely.
In closing, I would like to encourage everyone to reach for their phones and connect with a loved one.