Reframing Health and Healthcare
NIC Co-Founder and Strategic Advisor Robert Kramer has identified “Six Key Drivers” that will shape the senior living industry over the next 10 years. Kramer is also Founder & Fellow at Nexus Insights, a think tank advancing the well-being of older adults through innovative models of housing, community and healthcare. NIC Notes is publishing a bi-weekly series detailing each key driver. View the first three installments of the “Six Key Drivers” blog series. What follows is an analysis of the fourth key driver: Reframing Health and Healthcare.
 Our new customers, as discussed in Key Driver #3, have a different take on longevity. They are not content to just live longer, they want to live better. They want their lifespan to as nearly as possible to match their “healthspan” or “wellspan.”
But what does that mean? And how do we help them accomplish that?
My fourth key driver shaping the future of senior living is the reframing of health and healthcare. Senior living providers must shift their thinking about what constitutes health, what drives health, and ultimately what drives well-being.
This shift in the understanding of what drives health, and where and how healthcare is delivered presents enormous opportunities that had not previously existed for senior living providers. We have the opportunity not only to develop new and valuable partnerships, but also, and more importantly, to deliver a better product and experience for residents, and potentially even for those who live outside the walls of our communities.
The old model of how our U.S. health system is structured and healthcare is delivered is one of sick care. If you get sick, you go to the doctor. Treatments are tailored to the individual’s illness or condition, assuming you even have access to care. The model is curative, reactive and passive. If you fall, for example, you are treated for your injuries. There is no focus on how to prevent the fall in the first place.
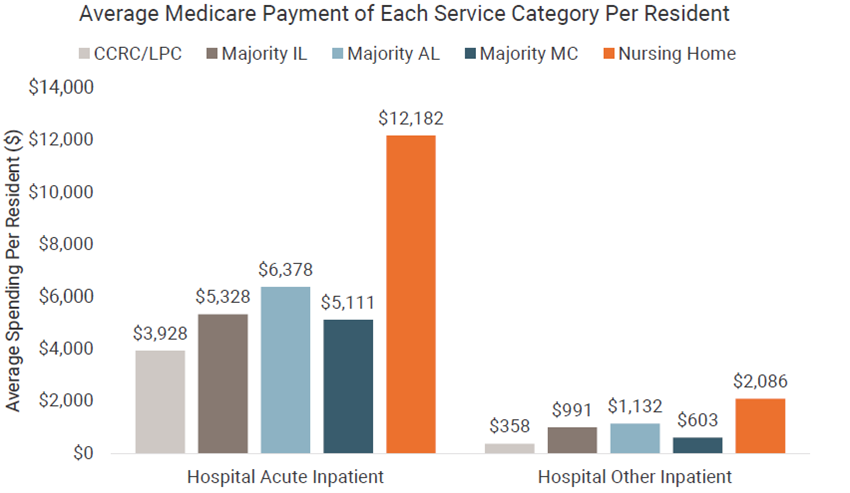
The sick care system is a fee-for-service model. Healthcare providers are paid to treat illnesses and injuries. As the older population grows and lives longer, federal and state governments are seeing healthcare expenses explode.
Medicare benefit payments in 2021 totaled $689 billion, up from just under $200 billion in 2000. Medicaid spending grew 9.2% in 2020. Federal and state governments have to reign in healthcare costs.
Driven by the government’s priority to control costs, a new and more nuanced model of healthcare has gradually been emerging over the last decade. Sick care is being replaced by well care or value-based care.
In stark contrast to the sick care model, the wellness model is preventative, predictive and participatory. Residents are empowered to participate in their own healthcare. They can help to control their own health outcomes by their behavior. Data can be used to predict who is at risk for certain conditions or ailments. And interventions can be designed to prevent bad outcomes.
Industry consultant Anne Tumlinson defines value-based care as a system of care delivery where the primary financial reward is tied to improving patient outcomes, measured against the cost of care. Government payers also want insurers and/or care providers to take on the dollar risk for the health of seniors because the current trajectory of spending is unsustainable.
It’s important to note that many healthcare providers have not yet adopted value-based care—a key point as senior living providers consider various healthcare partners in the years ahead. Many providers remain in the fee-for-service model of care.
What Determines Health
As the value-based healthcare system continues to evolve so too has the definition of health.
The mapping of the human genome provided insights into the influence of heredity on health, which experts say accounts for about 30 percent of an individual’s outcomes. Medical care is only about 10 percent of the equation. The remaining 60 percent is now understood to be shaped by personal behavior and the social determinants of health.
This is critical to senior living owners and operators. The social determinants of health are defined as the conditions in the environments where people are born, live, work, and age that affect a wide range of health, functioning, and quality-of-life outcomes and risks.
Where do you live? What kind of housing do you have? Is transportation readily accessible? Do you live in a food desert? What kind of social interactions do you have? Are you lonely? Social isolation can drive depression which drives a host of physical ailments as well as the obvious mental and emotional issues.
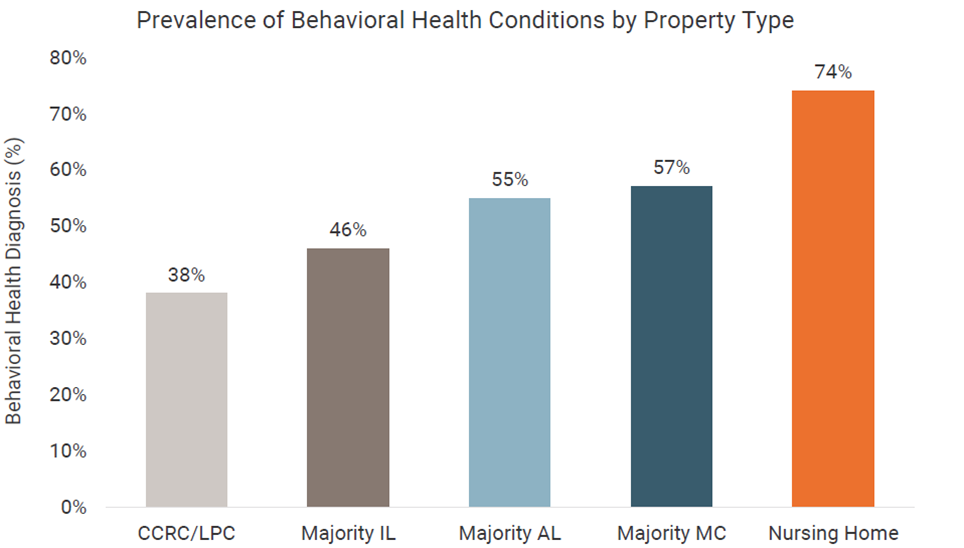
Notably, the pandemic brought mental and behavioral health out of the shadows, and it will not recede again. (See Key Driver #1). We have come to recognize the key role mental health plays in overall well-being.
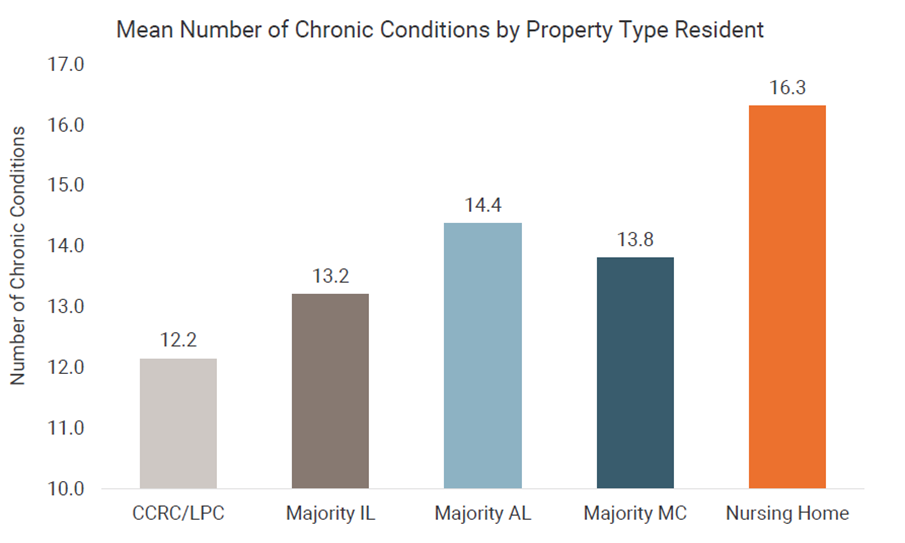
Our behavior has an enormous impact on health, particularly in regard to the management of chronic diseases. Do you smoke? Do drugs? Or drink? We know from studies that a healthy lifestyle consisting of a good diet, regular exercise and mental stimulation can add as many as seven years to the average person’s life.
A New Paradigm of Wellness
How will this new understanding of health and healthcare impact senior living providers in the decade ahead? For years, we didn’t want to say our buildings were involved in healthcare. We essentially built a moat around our buildings. There was no need for federal regulators to take an interest in our industry.
The pandemic changed that thinking almost overnight as senior living became the front line of defense in a national healthcare crisis. It signals a radical shift from a moat around our buildings to a moat around the hospital. What does this mean?
Any entity holding the healthcare dollar risk for that older adult is interested in partnering with us. Under value-based care, providers are incentivized to keep people out of the expensive acute care system. So, we are part of the solution by addressing the needs of our residents to reduce hospitalizations and emergency room visits.
Insurance companies and other payers play a big role. Medicare Advantage (MA) plans are growing quickly in popularity. It’s estimated that already 46 percent or more of Medicare beneficiaries are enrolled in MA plans, a number only expected to grow. The companies that underwrite the plans are incentivized to help people better manage their own health and thus minimize their need for costly crisis care.
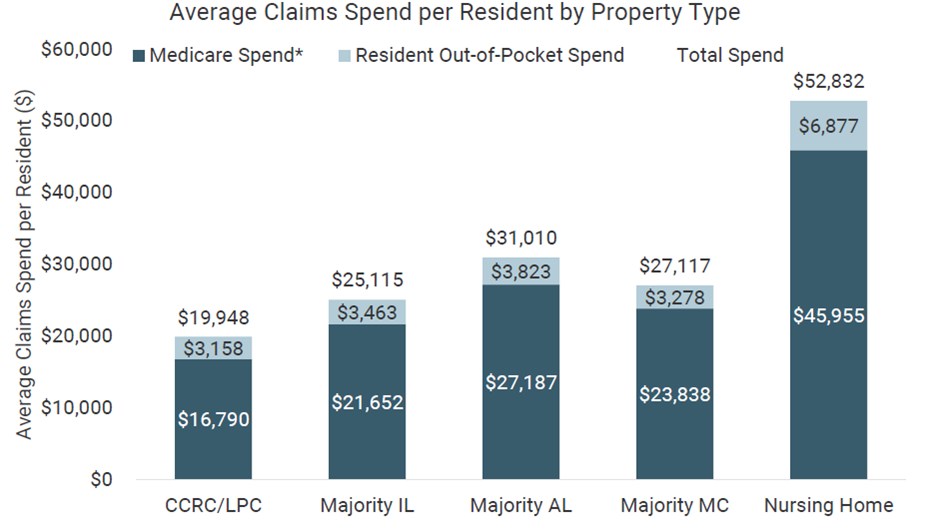
In particular, MA plans tend to focus on those who are at greatest risk—the top 20 percent in terms of healthcare spend—in an effort to help the break the cycle of hospitalization, discharge and rehospitalization. This vicious cycle is expensive. And each time the older person enters the acute care system, he or she usually has a poorer quality of life afterwards.
Why does this matter to senior living providers? They are in a unique position to partner with healthcare providers to help manage the chronic diseases common among their resident population. How?
We know our residents. The housekeeper or dining server notices when Mrs. Jones is having an “off” day. Senior living providers can be the eyes and ears of the healthcare team to coordinate appropriate interventions. In other words, we are part of the solution.
Several years ago, I was talking to a United Healthcare executive who said he’d give anything to have eyes on his plan members 24/7. What he meant was that he had no control over the social determinants of health, or his members’ personal behavior such as healthy eating, exercise, and socialization. It was hard to keep them healthy. My response: “I’d love to introduce you to a whole host of senior living providers who have their eyes on your plan members 24/7. We should chat.”
How Senior Living Providers Can Benefit
So, where and how should healthcare be delivered to residents?
The pandemic highlighted this question of where and how to deliver healthcare. Residents could not be sent to doctors’ offices because they were closed at the start of the pandemic. The hospitals were overwhelmed.
Now, the “where” of healthcare means delivering services to the home to the greatest extent possible. In our case, that means delivering healthcare on site to residents, a trend only likely to accelerate.
The “how” of healthcare delivery now means the use of technologies such as telehealth and remote patient monitoring. Healthcare professionals will make house calls to our residents and coordinate care with geriatric specialists.
This change in the “where” and “how” of healthcare delivery creates enormous opportunities for senior living providers in the future. But it also raises a lot of questions.
What kind of healthcare partnership makes the most sense? What kind of technology and data base do I need to enter into any type of partnership let alone make the partnership work? If you don’t have good data, you are not even a candidate to be a partner. What kind of doctors should I be looking for? What kind of value-based care program or payment model should I engage with? How do I deal with different payers and payment models? These are the kinds of questions senior living providers are asking or should be asking.
The answers will depend on the senior living provider and the local healthcare and payer market. Some senior living providers are partnering with physician practices that specialize in geriatrics. The team, which often includes nurse practitioners, can visit residents on site and/or be available 24/7 via telehealth. A quick call to the healthcare team can avoid a trip to the emergency room.
Here are three programs that serve as differing examples of how to integrate the new approach to healthcare into a senior living setting. Each model also provides the opportunity to bring services to seniors who live outside the walls of the senior living community.
At Juniper Communities, the Connect4Life program integrates clinical providers, their services, and communication protocols to provide individualized, coordinated care to residents. A medical concierge has the responsibility to make sure communication happens between clinical providers, the Juniper team, the family, and resident.
In the Twin Cities, Lifespark offers a proactive, whole person approach to address how seniors really want to live—a richer, fuller, healthier life. The Lifespark Complete program offers seniors a life plan featuring a life management advisor to guide the senior who works alongside a specially trained geriatric medical team, all of whom are supported by a technology platform that allows for the real time exchange of information and the predictive analytics to promote well-being.
Another example: senior living provider Generations has recently partnered with Blue Zones, an organization owned by the Adventist Health system. Blue Zones or longevity hot spots were first identified by Dan Buettner. He categorized the lifestyle habits of Blue Zone residents—the healthiest and longest-lived people in the world.
Generations already had a partnership with the Adventist Health system, co-developing three senior living campuses together. Residents at Generations’ communities will now have access to the Blue Zone program which emphasizes wellness. The Blue Zones brand also has wide recognition which will help attract new residents interested in a healthy lifestyle.
These three examples suggest features that will be essential to any successful integration of healthcare and senior living:
- An individual (advisor, concierge, life manager, etc.) who has a trusted ongoing relationship with the older adult and ensures good, timely communication between the resident, their family, healthcare providers, and the senior living staff.
- A specially trained geriatric medical team that begins with a focus on what matters most to the older adult, not on his or her latest health incident, chronic disease, or setting. (This concept will be explored in more detail in Key Driver #6: Moving from siloed to seamless as fragmented healthcare solutions migrate to integrated, consumer-centric care systems that are setting, disease and payer agnostic.)
- A database that allows real time transfer of essential information among all those involved in the care of the older adult and the ability to deploy predictive analytics.
As an alternative to these partnership models, some senior living providers are even starting their own insurance groups to actually take on the healthcare dollar risk for the residents in their buildings.
Whatever the approach, the benefits of a strategic healthcare partnership focused on wellness are potentially enormous. Healthier residents can translate into a longer length of stay. The average assisted living resident stays from 18 to at most 30 months. Extending the length of stay for each resident by just a month can have a huge impact on ROI.
Senior living providers can also leverage their focus on wellness and prevention to keep their residents out of the emergency room and the hospital. We can show a proven track record to residents, families, healthcare providers and those holding the healthcare dollar risk. But remember, not all providers are on board with value-based care. You have to be discerning in your partnerships. Many physician practices don’t get this, and many health systems don’t get it yet either.
If our policy consists of a van to take our residents to their doctor and on weekends we call the paramedics, that approach will eventually put you out of business. As the focus continues to shift from sick care to well care and value-based care in the decade ahead, senior living providers can be an integral part of a solution that benefits us all. Ultimately, healthier residents enjoy a higher quality of life which should be the common goal of residents, families, healthcare providers, insurers and payers, and senior living providers. Everyone’s interests can be aligned.
This leads to a need for partnerships. It’s a very rare senior living provider that can do it all in this world of well care and value-based care.
When senior living providers look for healthcare partnerships, data and analytics will play a key role along with providing a seamless integrated experience for the resident. (We will explore these concepts in our next two posts on the key drivers, publishing in the coming weeks.)
The value we will have to provide to future residents is to demonstrate that we enable not just a longer life, but a life span that as nearly as possible matches their “healthspan” or “wellspan.” That is our challenge.
Next up: Key Driver #5: The Increasing Importance of Data and Analytics. Market data by itself has limited value. In the future, Market data will be coupled with personalized health, genomic, social determinants of health (SDOH), lifestyle and psychographic data, and aggregated by local markets. The applications for the future use of this kind of data will be transformative for the industry.
 NIC COO Chuck Harry recently talked with two executives at Paychex about how senior living providers can address staffing challenges based on an understanding of what today’s workers want and expect. Here is a recap of his conversation with Paychex’s Kate Risa, strategic accounts consultant, and Brittany Riese, HR business partner.