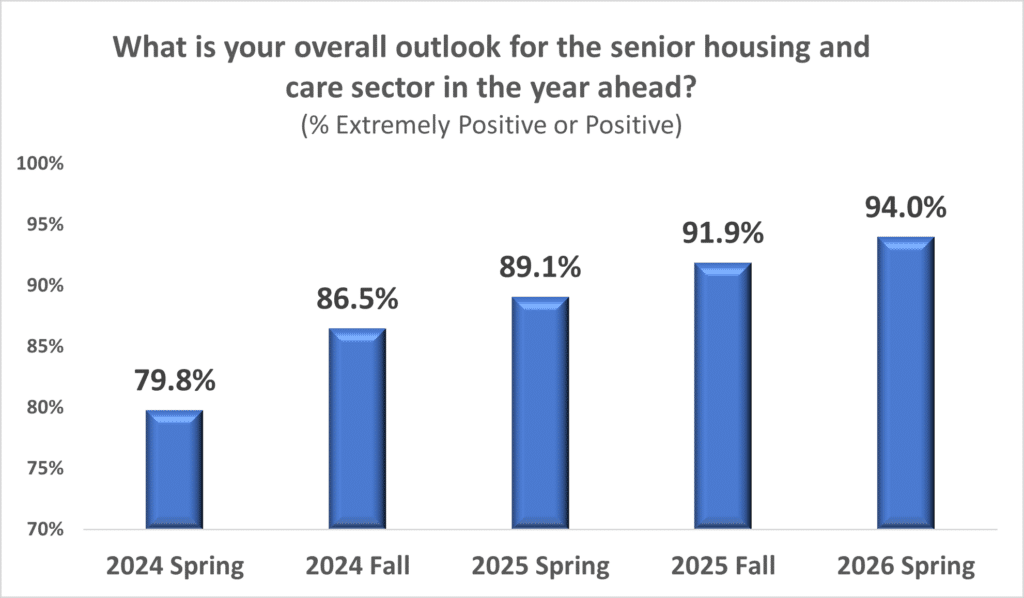
Senior Housing Industry Sentiment Hits Record High
Nearly 2,500 operators, investors, lenders, and other industry professionals convened in Nashville recently for the 2026 NIC Spring Conference. Attendees were polled on their outlook for the senior housing and care sector for the year ahead. The overall sentiment at this year’s conference reached a new record high with 94% of attendees responding that their outlook for the year ahead was ‘extremely positive’ or ‘positive.’
The vast majority of the remaining responses were ‘neutral’ in their reported outlook. The graph below reveals the overall industry sentiment going back to the 2024 NIC Spring Conference through today. Compared to two years ago, the overall industry sentiment has jumped more than 14 percentage points. These numbers clearly reflect the overall sector tailwinds and align with the general enthusiasm that attendees expressed throughout the conference.
C-PACE: A Growing Solution to Capitalize Senior Living Development
For senior living developers and owner-operators, the past few years have introduced a new reality: capital stacks are harder to assemble, traditional lenders are more conservative on ground-up development, and the margin for error on new development or repositioning deals has narrowed.
In that environment, one financing tool has quietly moved from the periphery to the center of the conversation: Commercial Property Assessed Clean Energy (“C-PACE”).
At a high level, C-PACE is a long-term, fixed-rate financing source designed to fund energy efficiency, water conservation, and resiliency improvements. In practice, C-PACE has become an effective tool available to close capital gaps, reduce overall cost of capital, and improve deal feasibility.
What makes C-PACE unique is its structure. Rather than a traditional mortgage, it is secured through a special property assessment and repaid along with the facility’s property taxes. It is typically non-recourse, carries a 20–30 year term, and remains with the property upon sale. These features allow it to behave differently than other forms of debt—and more importantly, to complement them.
That flexibility is exactly why adoption has accelerated. In 2025, C-PACE originations reached record levels, and the product has gained acceptance from some banks, debt funds, and institutional investors. What was once considered niche is now increasingly viewed as a standard component of sophisticated capital stacks.
Particularly in senior housing—where construction costs are high, lease-up risk is real, and operational complexity matters—traditional financing often provides around 60% loan-to-cost, and developers are increasingly turning to C-PACE to fill the capital stack and reduce the amount of equity required.
In many cases, it functions as a replacement for more expensive capital: where a developer might otherwise rely on mezzanine debt or preferred equity to increase leverage, C-PACE can fill that same position at a significantly lower, fixed cost. The result is a more efficient capital stack and improved projected returns, as lower equity requirements, all things equal, result in a better IRR for the project.
This dynamic is playing out across a range of use cases relevant to senior living. Ground-up developments are using C-PACE to bridge financing gaps created by tighter construction lending terms. Value-add and repositioning projects are using it to fund system upgrades—HVAC, building envelope, and water systems—that both qualify for C-PACE and improve operating efficiency. Some owners are even using C-PACE in recapitalizations, either to refinance existing assets or to generate liquidity through retroactive financing of previously completed improvements.
That last point is particularly important. Most states allow a 1-3 year lookback for C-PACE programs, meaning that recently completed projects may already be eligible. For owners facing loan maturities or seeking to recapitalize, C-PACE can be used to create liquidity after initial development has already occurred.
Importantly, the growth in C-PACE utilization has been accompanied by increased institutional acceptance. Lenders who were once cautious are now comfortable incorporating C-PACE into their structures, provided it is well underwritten and properly sized.
As with any capital solution, there are tradeoffs which owners must consider. C-PACE programs are enacted and enabled by state legislatures, and not every state has an active program. Specifics can also vary by state. Developers and owners should also be cognizant of longer-term capital planning. Permanent loan programs, like HUD, do not currently allow for C-PACE financing to remain in place upon permanent loan closing.
Looking ahead, C-PACE is poised to remain as an arrow in the quiver of commercial real estate finance. While debt markets continue to heat up for acquisitions and recapitalizations, underwriting discipline remains tight especially for new construction. That creates ongoing demand for capital that can sit alongside senior debt without forcing lenders to stretch beyond their comfort zone.
In a market where cost of capital, execution certainty, and capital stack creativity increasingly determine which projects move forward, C-PACE can offer a distinct advantage. It can reduce add leverage, reduce the blended cost of capital, and unlock deals that might otherwise stall.
And in today’s environment, that often makes all the difference between a deal that works on paper and one that actually gets built.
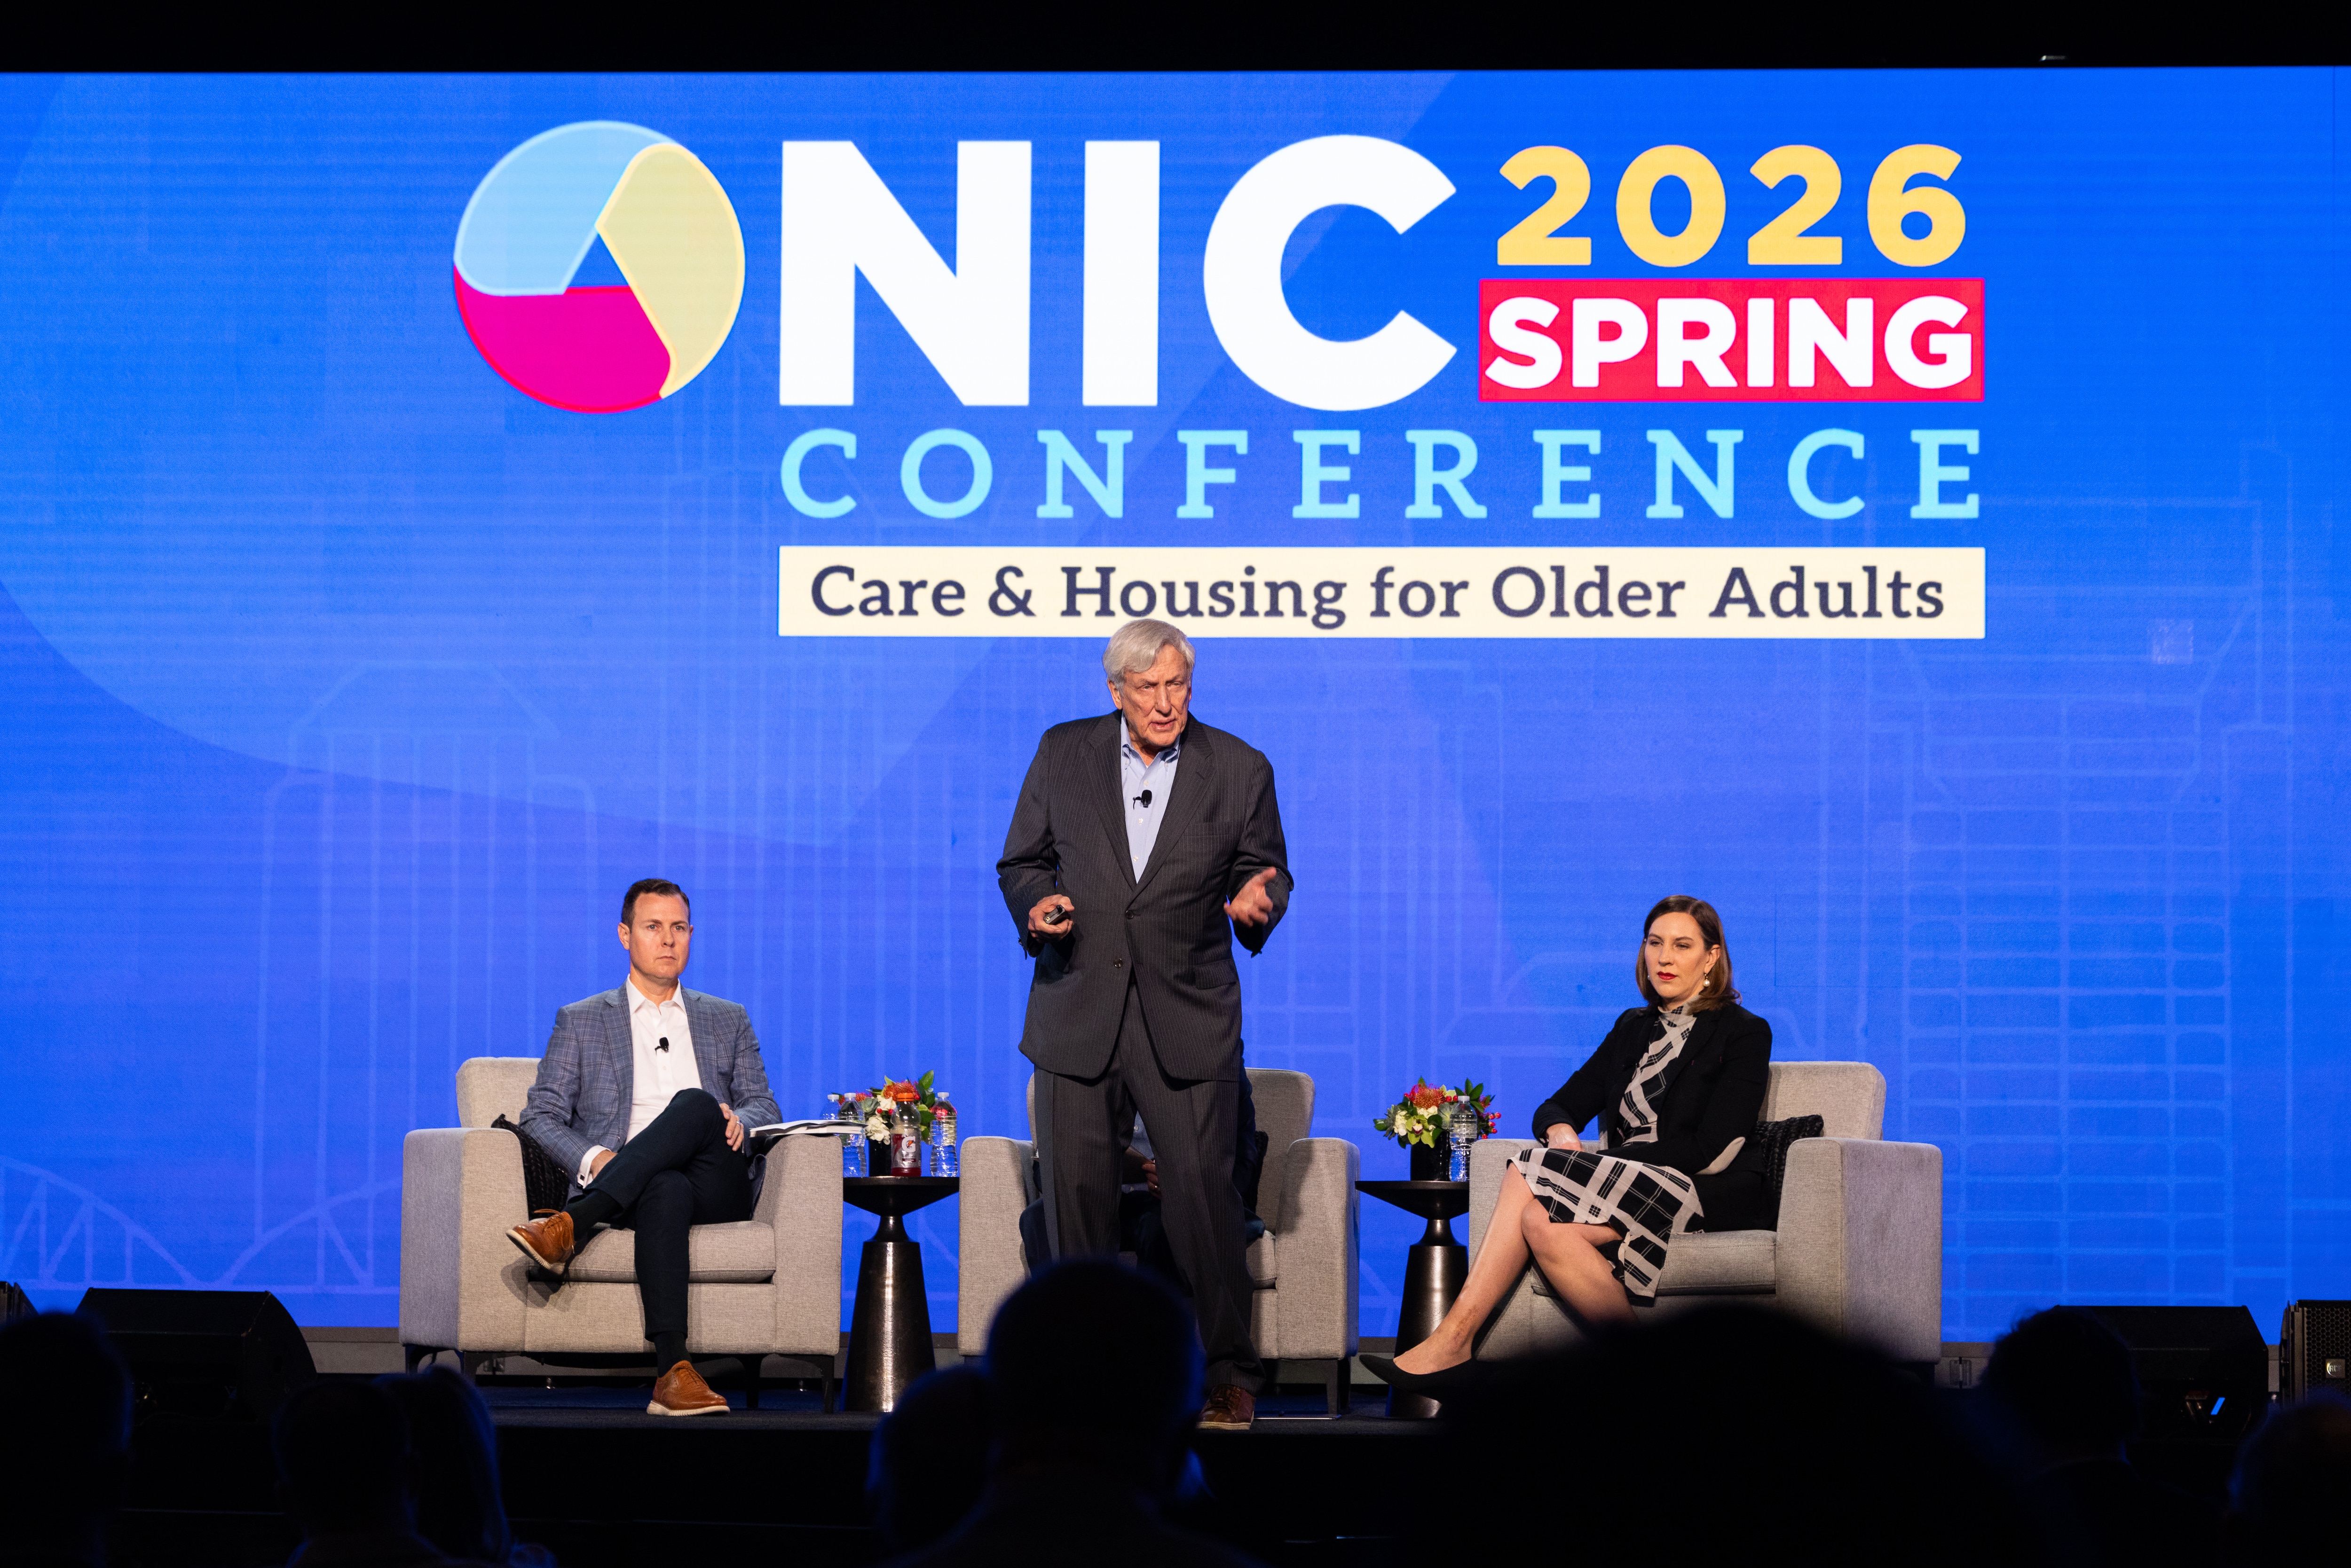
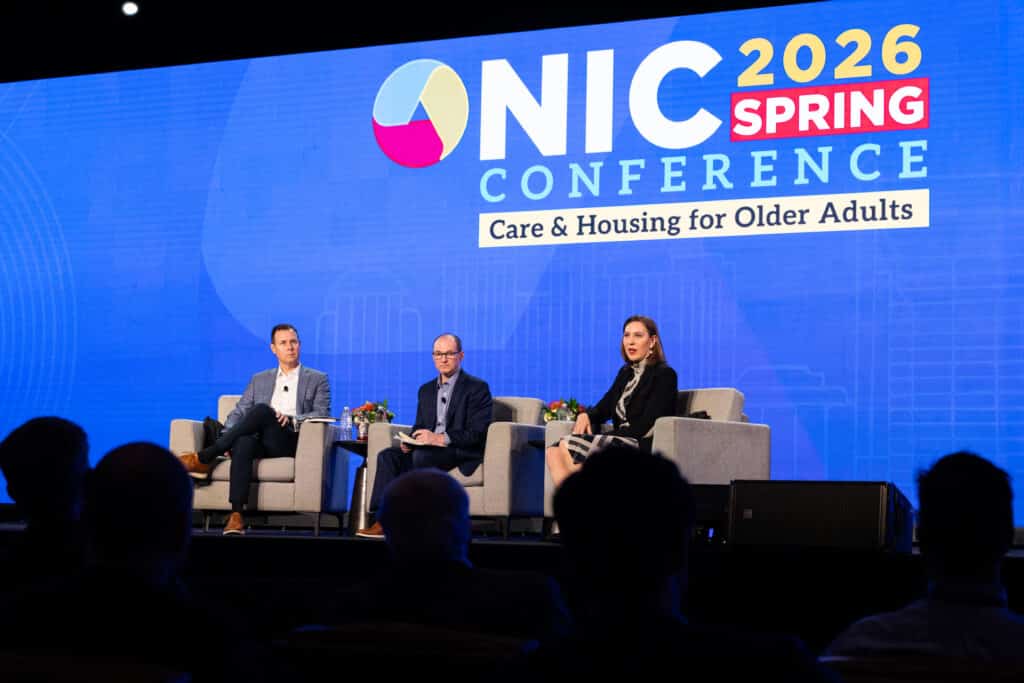
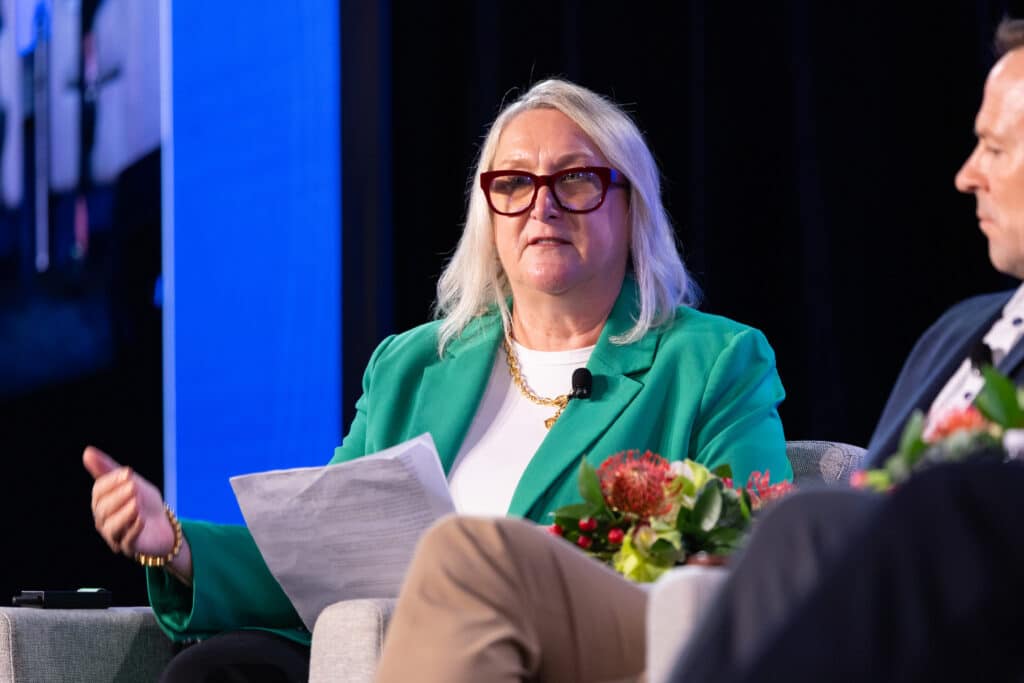
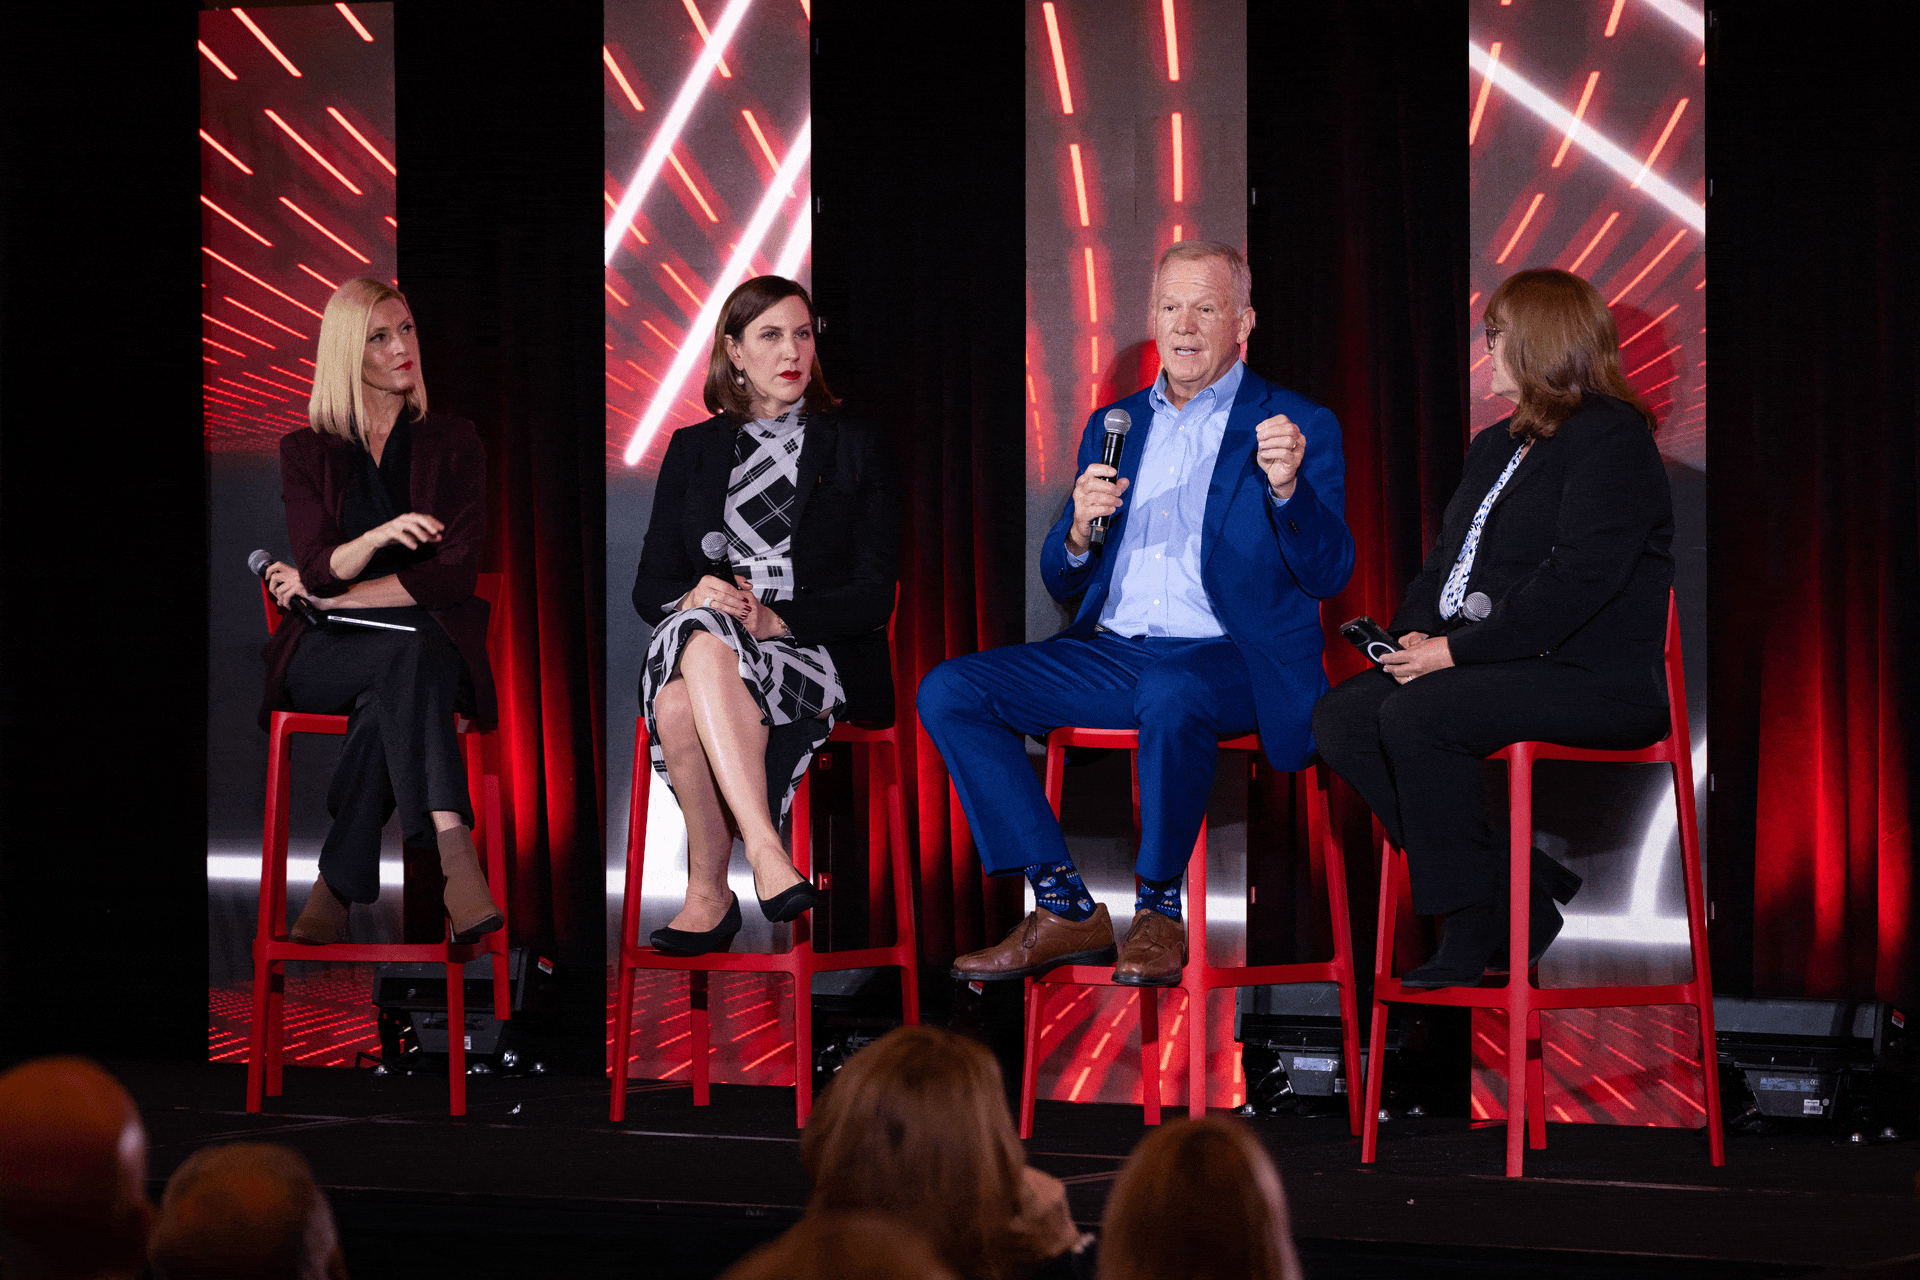
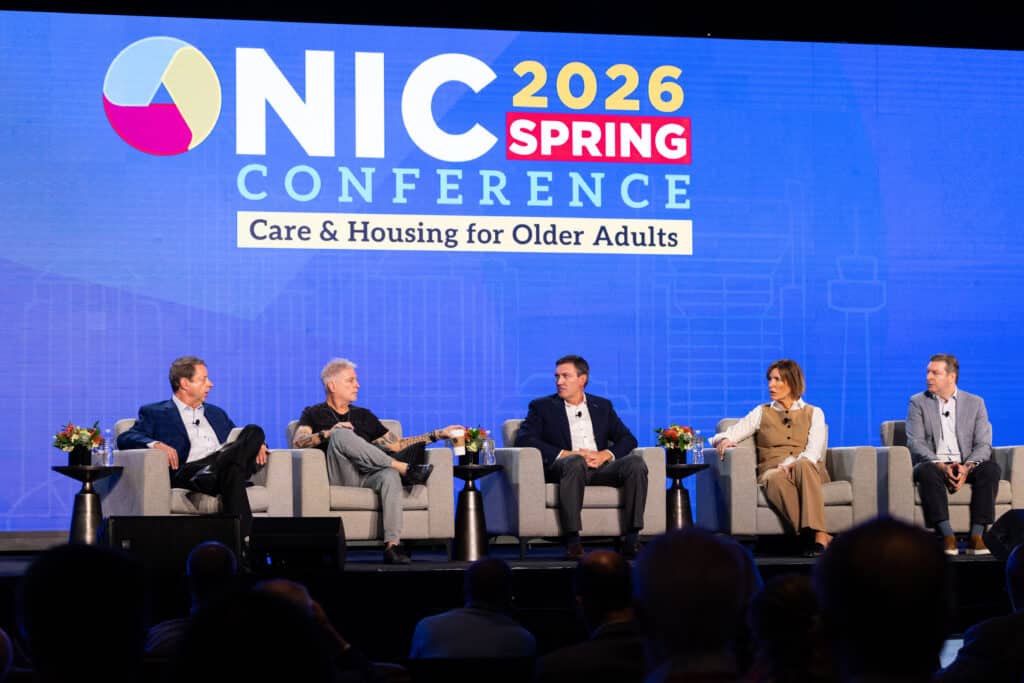
High Attendance, Strong Engagement Drive Success at NIC Spring Conference
The 2026 NIC Spring Conference exceeded expectations, drawing record attendance and generating a palpable sense of enthusiasm about what’s next for senior housing and care. Attendees from across housing, healthcare, and capital markets enjoyed three days of meaningful networking, insightful educational sessions, and dynamic discussions.
Welcoming nearly 2,500 attendees, the conference, held March 30-April 1 in Nashville, was NIC’s largest Spring event to date. The meeting’s theme focused on the intersection of senior housing and healthcare.
Beth Mace, Mark Zandi
“The big turnout is a testament to the growing interest in the sector and its expansion,” said Ray Braun, president and CEO at NIC. “Participants were able to explore strategies that support smarter investment, stronger operations and improved outcomes for seniors.”
The Conference featured evening receptions, networking lounges, a reception for first-time attendees, and a women’s networking meetup. Participants had numerous opportunities to connect, exchange ideas, build relationships, and make deals with other decision makers.
The educational program was carefully curated to highlight the insights and innovations defining senior housing’s future, from capital markets and investment strategies to the increasing integration of housing, healthcare, and supportive services.
Setting the tone of the event, the conference kicked off with a clear-eyed view of the U.S. economy in a NIC Signature Session. Mark Zandi, chief economist and director of Economic Research at Moody’s Analytics, was interviewed by former NIC Chief Economist Beth Mace to a standing-room-only audience.
“Senior housing has a lot of opportunity,” said Zandi. But he cautioned that worldwide disruptions would likely result in higher inflation and lower growth going forward.
Mace asked when development might return to senior housing. Zandi said the demographics are positive and baby boomers are a wealthy generation. “The pre-conditions are there for more development,” he said.
Senior housing and healthcare take center stage
Another highlight was a NIC Premier Session with Gary Bacher, chief strategy officer at the CMS Innovation Center. James Lydiard, CEO at Centered Care, and partner at the Senior Living Transformation Company, led a discussion featuring Bacher and Caroline Pearson, executive director at the Peterson Health Technology Institute.
Jim Lydiard, Gary Bacher, Caroline Pearson
The panel focused on new initiatives from the CMS Innovation Center and how senior housing and care operators can participate and get paid for the positive health outcomes of residents.
Where to start? Make sure residents have primary care and work with physician groups to help residents navigate the system. And engage with value-based care initiatives being launched by the CMS Innovation Center. “It all begins with the needs of the residents,” said Bacher.
A follow-on panel titled “Senior Housing’s Long-Overdue Moment in Healthcare” presented concrete models of care to demonstrate improved health outcomes for residents and cost savings. “Senior housing operators have the opportunity to earn additional revenue through value-based care models,” said Anne Tumlinson, of ATI Advisory. She was joined by Joel Theisen of Lifespark and Jacob Swint of National Church Residences. “Find a partner that knows what they are doing in value-based care,” suggested Swint.
Further insights on healthcare and senior housing
“Insights from Nashville’s Leading Health Innovators” brought together three healthcare executives from Nashville, home to 900 healthcare companies. The NIC Premier Session was led by Leigh Ann Barney, CEO of Trilogy Health Services. “We are trying to align incentives between payers, operators and providers,” noted George Renaudin II, president, Insurance, Humana.
Leigh Ann Barney
NIC Co-Founder and Strategic Advisor Bob Kramer moderated “Navigating State Regulatory and Medicaid Waiver Models: An Evaluation Framework.” He noted, “The regulatory and waiver environment is critically important.” Leaders from Georgia, Oregon, Minnesota, and California state associations outlined their state’s approach to Medicaid waivers and senior housing. The consensus was that each state differs and the local market is key. Kramer also noted that Medicaid cuts in the recent federal budget adds a layer of complexity to the situation that operators need to be aware of.
“Leading the Transformation: Skilled Nursing Models for Tomorrow,” was led by Mark Parkinson, principal, American Health Care Association, CEO, Park Place. Panelists shared how they are adapting business and care models amid a changing landscape — navigating regulatory complexity, structuring reimbursement and partnership carve-outs, and aligning with hospitals and payers to deliver value.
“We used to think you had to choose between great quality outcomes and great financial outcomes, but now we know from the data that you can do both,” said Parkinson. Panelist Barry Munk, CEO, Marquis Health Consulting Services, added, “We found that the more we invest in our facilities, the better our outcomes.”
Forward-thinking programming
Barry Munk
The Innovation Labs were well attended. Topics included Modernizing Memory Care; Demystifying Tech Investments; Small House Models; Incentivizing and Retaining Your Property Level Leadership, and The Value-Based Care Journey. Panelists offered practical solutions and first steps to operational success. True to the innovation moniker, the sessions each provided creative and insightful ideas, strategies, and emerging models. Watch for a future NIC article offering highlights.
With staffing a top priority for owners and operators, NIC Head of Research & Analytics, Lisa McCracken, held a conversation with Ron Hetrick, principal economist at Lightcast. The NIC Premier Session provided a broad, data-rich overview of the labor market and what it means for the future of care.
The final day of programming ended on a high note with sessions on the active adult market and a deep dive into the state of the capital markets and valuations.
Innovation Lab
The active adult panel emphasized that successful projects create a community. “The whole business is built on human capital,” said Michael Levine, senior managing director, Greystar. Programming for residents is essential to maintain high occupancies, but most markets still need to be educated about the product.
Introducing the NIC Signature Session on capital markets, moderator Thilo Best, principal, Bayshore Retirement Partners, noted that investor interest in senior living is growing because of the sector’s strong fundamentals. “We’ve never been as optimistic as we are now about senior housing,” he said. Panelists noted that cap rates for the best projects are compressing and valuations are increasing.
Thilo Best, Rick Matros, Brandon Ribar, Kathy Ryser
Rick Matros, president and CEO, Sabra, said he believes that new development will not be a significant factor in the next five years. “There are good times ahead,” he said.
The conference concluded with a reminder about the upcoming 2026 NIC Growth Conference, May 13-14, 2026, in Indianapolis, Indiana. The event is tailored for small to mid-sized senior housing operators and their partners to provide the tools and strategies needed to scale efficiently and boost performance.
Strategic Value-Based Care Partnerships: How They Can Support Senior Living Operators
By Susan DiMickele, President & CEO, National Church Residences, and Jacob Swint, VP, Strategic Growth & Operations Support, National Church Residences
Value-based care (VBC) has moved from an emerging concept to an operating reality, reshaping expectations around outcomes, cost, and resident experience. Yet many senior living operators are still asking a fundamental question: “What does a strategic VBC partnership look like from the operator’s seat?” In an increasingly complex environment, the distinction between a vendor relationship and a strategic partnership with a primary care group determines whether an operator experiences marginal improvement or a meaningful transformation of their value proposition.
What Makes a Value-Based Care Partnership Truly Strategic for Operators
From an operator perspective, a VBC partnership with a primary care group becomes strategic when it begins with shared accountability. The most effective partnerships align not only around clinical outcomes, but around the metrics operators manage every day: resident length of stay, occupancy, staff turnover, and family satisfaction. If a clinical partner cannot directly influence the operator’s core business drivers, the relationship is unlikely to deliver sustained impact.
A second hallmark of strategic partnership is the presence of a deeply integrated clinical model tailored specifically for senior housing. Across the National Church Residences portfolio and our primary care medical group, At Your Door – Visiting Healthcare Services, we have seen the effectiveness of onsite primary care teams supported by physicians, advanced practice providers, registered nurses, care managers, and social workers. This interdisciplinary structure reduces unnecessary emergency department use, improves continuity of care, and supports the “Quadruple Aim” of enhanced care quality, lower cost, improved experience, and reduced staff burnout.
Most critically, strategic partnership requires aligned incentives and shared value creation. For years, external medical groups have operated within senior housing but retained most of the economic upside associated with VBC performance. Yet senior living operators have been creating value for decades through stable housing, early issue identification, and daily resident support. A true partnership recognizes this contribution by offering operators a meaningful seat at the table, including the ability to participate financially in VBC outcomes.
How to Approach Partnership Strategy in a Still-Evolving VBC Landscape
The VBC landscape continues to evolve with new payment models, shifting benchmarks, and increasing expectations for risk management. Operators cannot rely on prediction alone; they need partnerships that are flexible, resilient, and prepared for what’s next.
Operators should look for partners with experience across multiple reimbursement arrangements and the ability to manage risk, matching the operator’s readiness rather than forcing a one-size-fits-all model. They should also prioritize partners who are willing to provide them with access to VBC programs, especially as many operators lack the capital or internal expertise to develop clinical capabilities in-house.
The right primary care partner lowers the barrier to entry by providing the infrastructure, compliance, reporting, and staffing necessary to support the operator while enabling operators to stay focused on resident experience, staffing, and community operations. When done well, these partnerships can unlock an additional revenue stream for the senior living operator while strengthening key business outcomes including occupancy, length of stay, and staff retention.
Reflections to Help Leaders Form Partnerships More Intentionally
Several observations can guide operators as they evaluate potential VBC partners:
Start with the “why,” not the reimbursement model. Anchor decisions in resident needs, operator pain points, and long-term goals.
Prioritize operational integration. The clinical team must become part of the community’s daily rhythm and not a visiting external entity.
Demand radical transparency. Data access, performance review, and shared decision-making are non-negotiable in VBC.
Shared financial participation. Operators should insist on direct participation in financial upside.
Evaluate cultural alignment. Trust, mission fit, and communication often matter as much as clinical expertise.
Consider risk management and risk tolerance. Understanding a partner’s ability to manage, share, and communicate risk exposure is essential for long-term sustainability in VBC.
The senior living industry is at a pivotal moment. VBC-aligned primary care partnerships are no longer experimental. They are becoming foundational infrastructure for the future of senior living. It is no longer a question of “if” a senior living operator should be participating in VBC programs and a matter of “how”. Organizations like NIC are essential in educating and convening leaders around this shift so operators can finally be recognized and rewarded for the value they have been creating for decades.
Independent Living Segment Sees Wider Rate Discounts in 4Q 2025
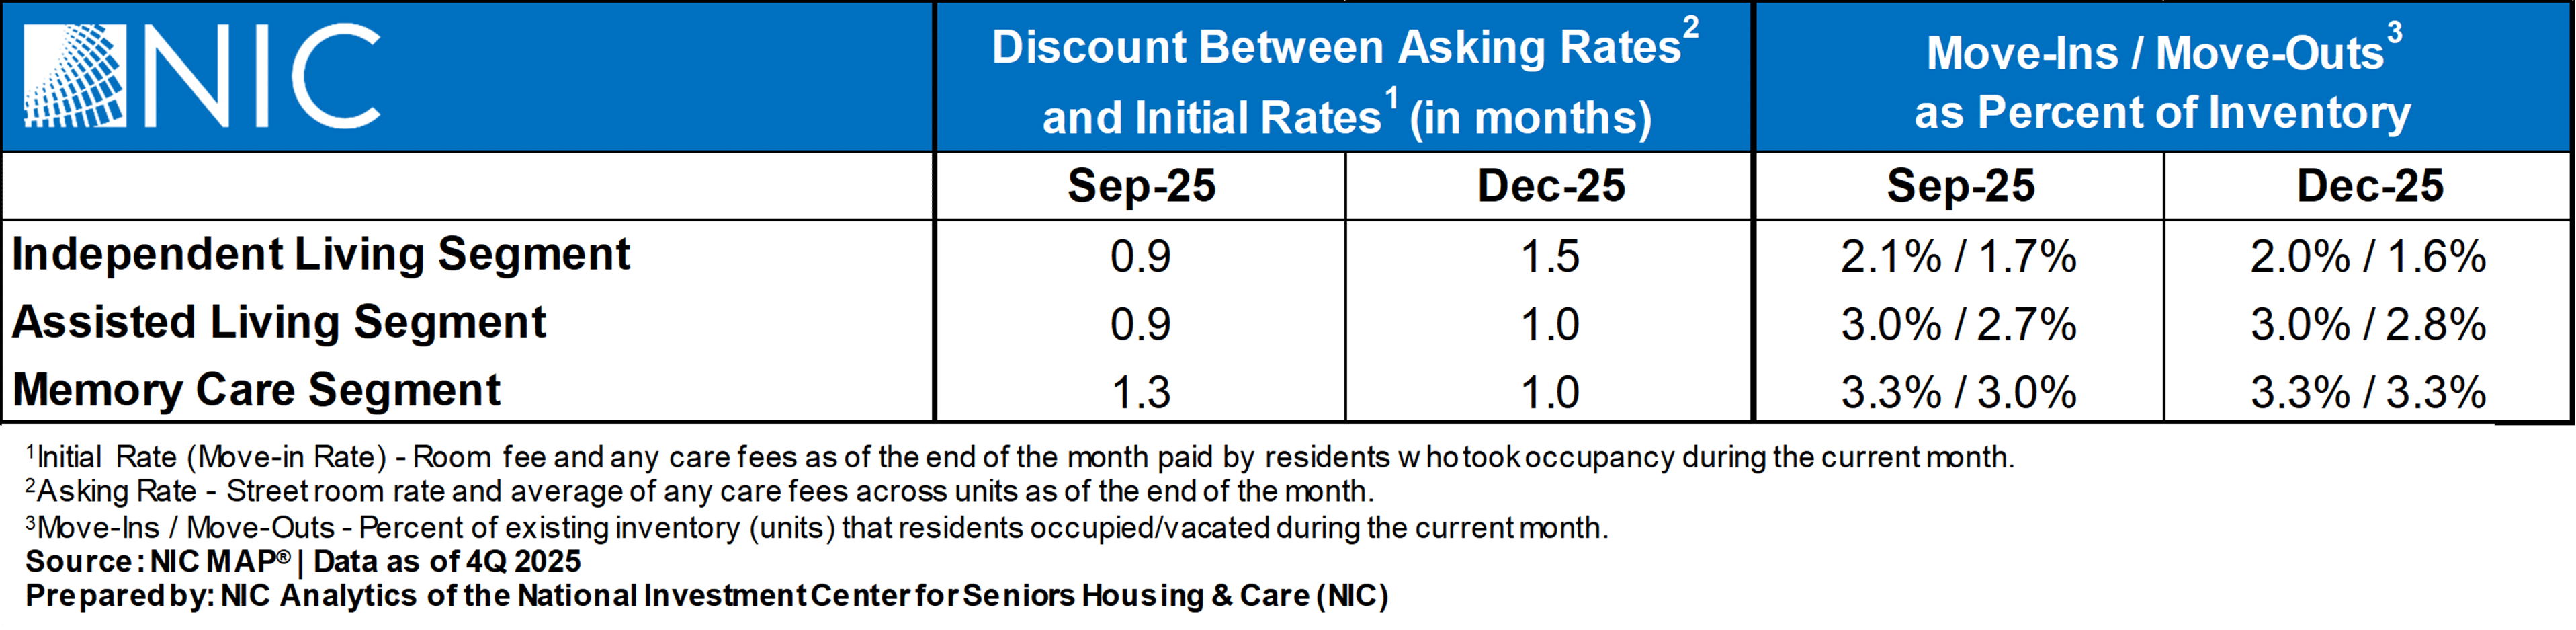
Data from the recently released 4Q 2025 NIC MAP Actual Rate Report showed that:
In 4Q 2025, discounts between asking and initial rates widened for the independent living (IL) segment and narrowed for the memory care (MC) segment.
For the IL segment, discounts between asking and initial rates averaged 12.1% ($581) in December 2025, equivalent to a 1.5-month discount on an annualized basis, up from a 0.9-month discount in September 2025.
For the assisted living (AL) segment, average initial rates were 8.0% ($556) below asking rates in December 2025, translating to a 1.0-month discount on an annualized basis, up slightly from a 0.9-month discount in September 2025.
Discount between asking rates and initial rates in the MC segment averaged 8.2% ($750) in December 2025, translating to a 1.0-month discount on an annualized basis, down from a 1.3-month discount in September 2025.
Move-ins outpaced move-outs for the IL and AL segments in the fourth quarter of 2025.
The percentage of move-ins for the IL segment averaged 2.0%, while move-outs averaged 1.6% in December 2025.
For the AL segment, move-ins averaged 3.0% of inventory in December, while move-outs averaged 2.8%.
In the MC segment, both move-ins and move-outs averaged 3.3% of inventory in December 2025.
Additional key takeaways are available to NIC MAP subscribers in the full report.
About the Report: The NIC MAP Seniors Housing Actual Rates Report provides aggregate national data from approximately 300,000 units within more than 2,500 properties across the U.S., operated by over 50 senior housing providers. The operators included in the current sample tend to be larger, professionally managed, and investment-grade operators as a requirement for participation is restricted to operators who manage five or more properties. Visit the NIC MAP website for more information.
We use cookies on our website to give you the most relevant experience by remembering your preferences and repeat visits. NIC's privacy policy can be viewed here. By clicking “Accept”, you consent to the use of ALL the cookies.
This website uses cookies to improve your experience while you navigate through the website. Out of these cookies, the cookies that are categorized as necessary are stored on your browser as they are essential for the working of basic functionalities of the website. We also use third-party cookies that help us analyze and understand how you use this website. These cookies will be stored in your browser only with your consent. You also have the option to opt-out of these cookies. But opting out of some of these cookies may have an effect on your browsing experience.
Necessary cookies are absolutely essential for the website to function properly. This category only includes cookies that ensures basic functionalities and security features of the website. These cookies do not store any personal information.
Functional cookies help to perform certain functionalities like sharing the content of the website on social media platforms, collect feedbacks, and other third-party features.
Performance cookies are used to understand and analyze the key performance indexes of the website which helps in delivering a better user experience for the visitors.
Analytical cookies are used to understand how visitors interact with the website. These cookies help provide information on metrics the number of visitors, bounce rate, traffic source, etc.
Advertisement cookies are used to provide visitors with relevant ads and marketing campaigns. These cookies track visitors across websites and collect information to provide customized ads.