Registration now open
Back by popular demand, the 2018 NIC Seniors Housing Boot Camp, The Art of Assessing a Deal, will be held Wednesday, October 17 from 10:00 am – 2:00 pm at the Hyatt Centric Chicago. Boot Camp is an interactive workshop for professionals looking to familiarize themselves with the unique aspects of investing in seniors housing real estate.
This year, Boot Camp has been expanded to allow thought-provoking discussions from experienced industry experts who will review essential tools they use for successful deal making. The expanded half-day workshop has been designed to provide participants the opportunity to join the conversation and take part in comprehensive discussions reviewing current market conditions and trends, critical analyses that assess opportunities, and other important operational considerations.
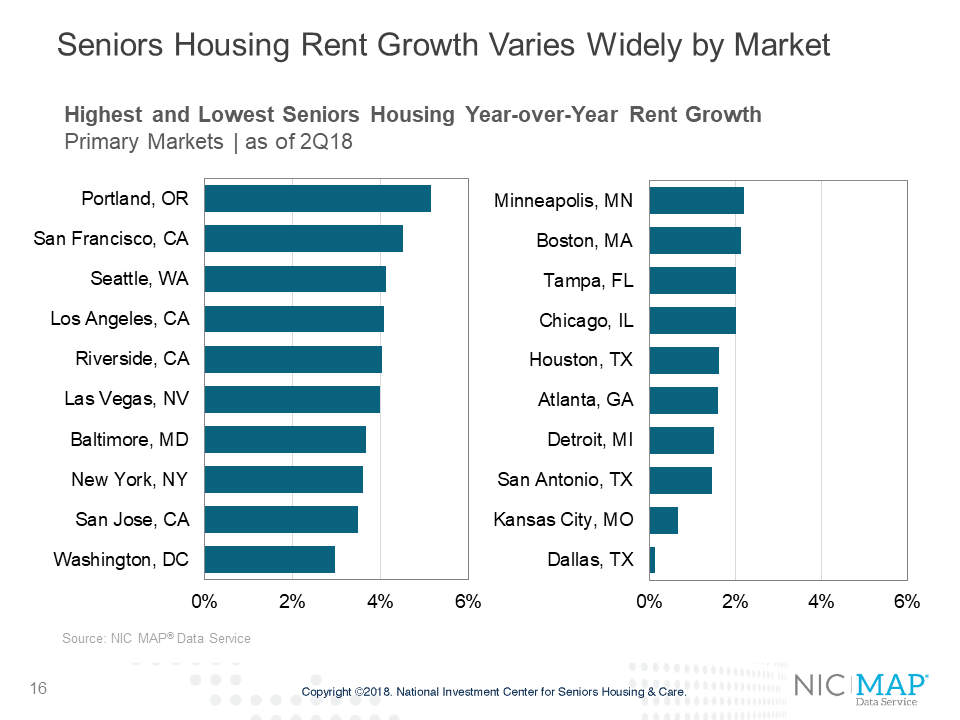
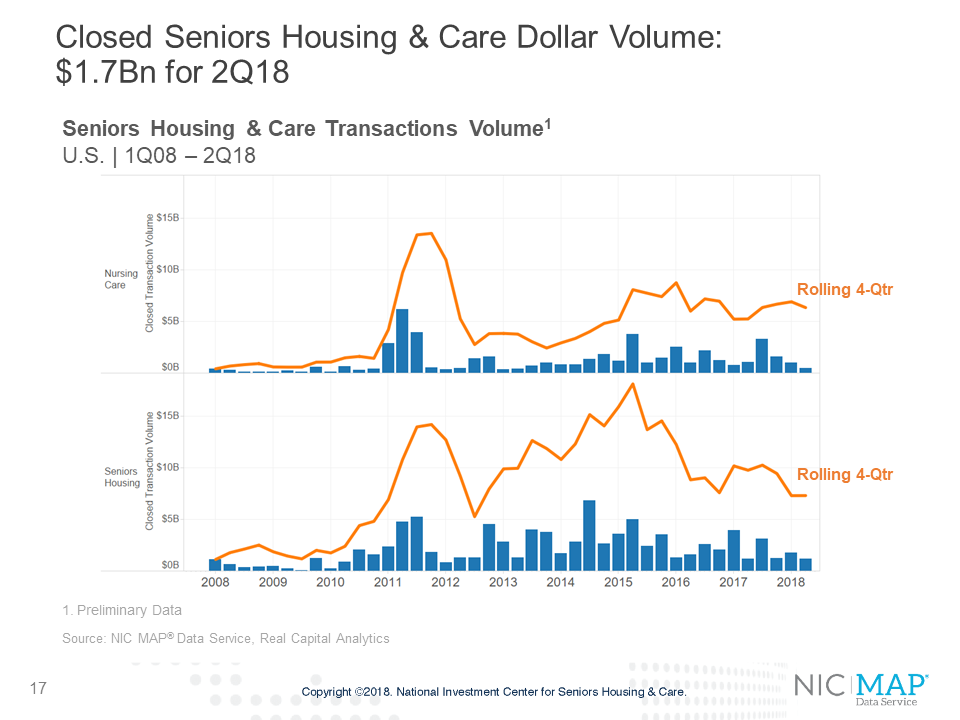
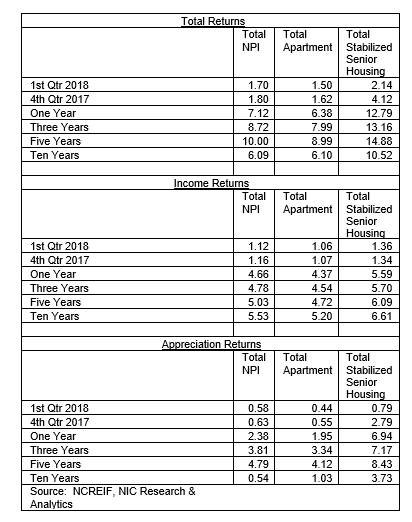
Using recent NIC Map® data, participants will be immersed in a discussion on current seniors housing market fundamentals and trends, transactions volumes and valuations. Building upon this groundwork, boot campers will then actively participate in a discussion of a seniors housing property acquisition opportunity using a real-life offering memorandum (OM) that focuses on the operation of a property.
Expert facilitators will share perspectives on important topics such as analyzing market supply and demand, determining the investment thesis and strategy, and learning how buyers can access capital to finance the acquisition. After the deep dive discussion on the elements of assessing an opportunity, the workshop will focus on how operational strategies such as labor, staffing, sales and marketing can affect the property’s occupancy, net operating income, and valuation. These discussions will focus on current challenges facing seniors housing operators and provide tips for success.
The session culminates in an opportunity for boot campers to apply the knowledge gained in the workshop to develop a bid and compete to purchase the property.
Boot camp participants will leave with a better understanding of what to look for, how to assess an opportunity and then decide if they should bid, sell or walk away from a hypothetical opportunity.
New to the workshop this year, industry icon Bob Kramer will share current industry insights. His presentation will provide his thoughts on the future of seniors housing and care and offer insights on the opportunities as well as the challenges facing investors today.
Join us. The 2018 NIC Senior Housing Boot Camp will provide participants tools for deal assessment as well as a great opportunity to network with colleagues and experienced industry thought leaders. We hope to see you and your colleagues there!
We invite you to learn more about the facilitators and how to register. (Space is limited.)