On January 15th, NIC MAP released fourth quarter data for the more than 850 active adult rental communities they track across the U.S. These communities cater to mostly healthy adults age 55+ who want to live in a community designed for active lifestyles and interaction with peers and who do not yet need or want on-site healthcare services.
Key takeaways included the following:
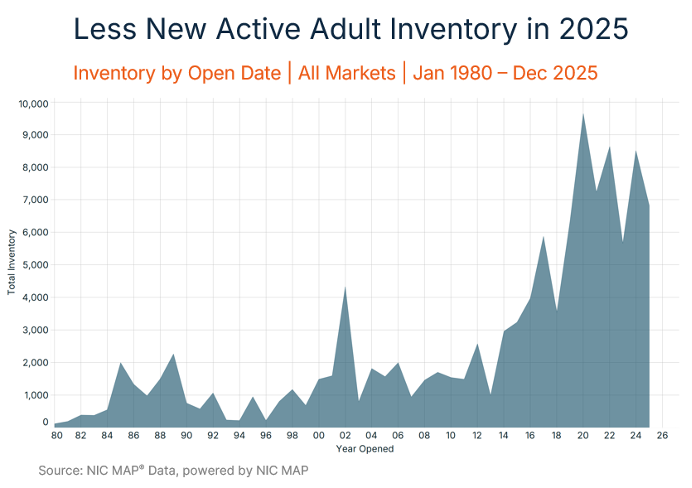
Takeaway #1: Less New Active Adult Inventory in 2025
- In 2025, roughly 6,800 new units opened, a decline from the 8,500 new units delivered in 2024.
- Although inventory is tracked back to 1980, older inventory is likely driven by naturally occurring retirement communities or conventional age-restricted apartments rather than active adult communities.
- Roughly half of today’s inventory opened in the past 10 years, which is the more modern lifestyle-focused product we see being developed today, with one-third developed since 2019.
- If you are interested in diving further into these active adult property type nuances, check out a recent episode of the NIC Chats Podcast with Cushman & Wakefield where we discuss market trends and valuation insights for active adult rental communities.
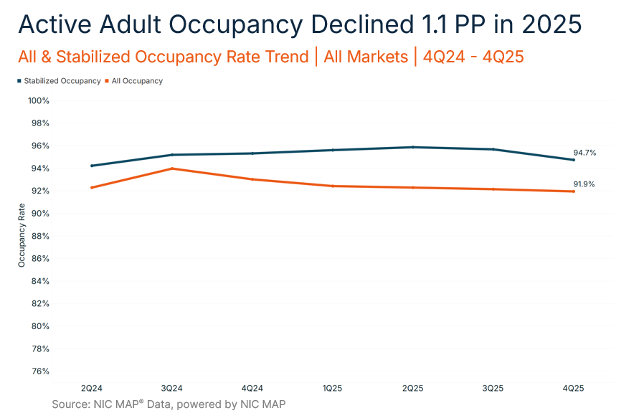
Takeaway #2: Active Adult Occupancy Declined 1.1 Percentage Points in 2025
- Although new supply was lower in 2025 than 2024, this new inventory may have had a moderate impact on occupancy rates.
- The active adult occupancy rate stood at 91.9% in the fourth quarter, edging down 0.2 percentage points from the prior quarter and declining 1.1 percentage points for the full year 2025.
- The active adult occupancy rate includes all properties, including those still in lease-up. As a result, the dip may have been driven from new units arriving online that are still being absorbed.
- Overall, occupancy rates have ranged from 92% to 94% over the past seven quarters since NIC MAP began tracking this data.
- For stabilized properties open at least two years, occupancy rates are near 95%.
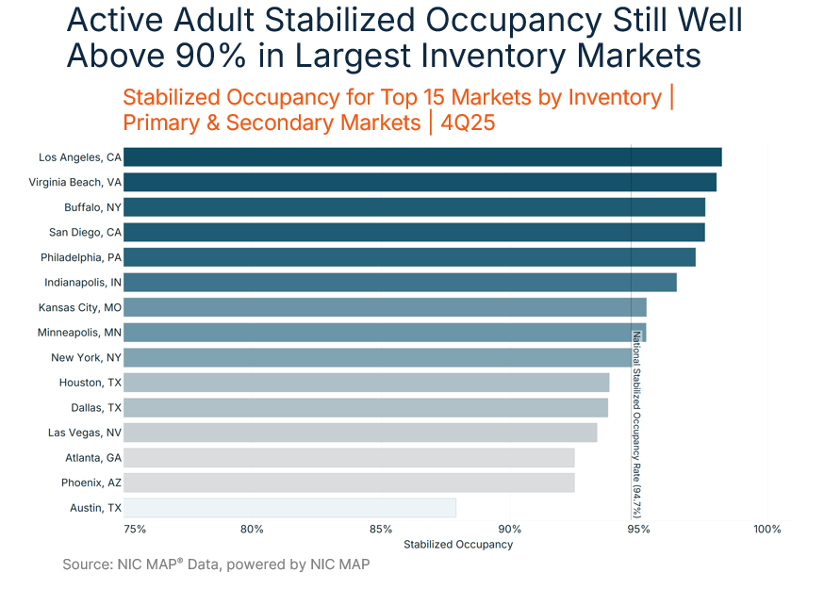
Takeaway #3: Active Adult Stabilized Occupancy Still Well Above 90% in Largest Inventory Markets
- Across the Primary and Secondary Markets, 14 of the 15 largest inventory markets have occupancy rates above 90%, with only Austin falling below 90%.
- Anecdotally, we are hearing from industry experts that the bottom six markets in the chart have had a lot of new supply over the past few years and, as a result, are seeing signs of slower lease up and lower rent growth.
- Stay tuned in 2026 as NIC MAP continues to roll out active adult data within its platform and across markets, including inventory, occupancy, and rents.