Assisted Living Occupancy Rate Slips to a New Low, While Independent Living Occupancy Rate Remains Above 90%
FOR IMMEDIATE RELEASE: April 12, 20118
Contact: Mary Ann Donaghy, 301-974-5797 or madonaghy@nic.org
ANNAPOLIS, Md. – The occupancy rate for seniors housing properties averaged 88.3% in the first quarter of 2018 down 0.5 percentage point from the prior quarter and down 0.9 percentage point from year-earlier levels. This placed occupancy 1.4 percentage points above its cyclical low of 86.9% reached during the first quarter of 2010 and 1.9 percentage point below its most recent high of 90.2% in the fourth quarter of 2014.
The occupancy rates for independent living properties and assisted living properties averaged 90.3% and 85.7%, respectively, during the first quarter of 2018. The occupancy rate for independent living was down 0.4 percentage point from the prior quarter and down 0.6 percentage point from year-earlier levels. The occupancy rate for assisted living was down 0.7 percentage point from the fourth quarter. The occupancy rate for assisted living was down 1.3 percentage point from year-earlier levels.
“The quarterly decline in the occupancy rate for assisted living stemmed from a marked slowdown in first quarter absorption as well as less inventory growth. Winter weather typically causes a slowdown in both inventory growth and demand in the first quarter. This year a particularly harsh flu season may have also slowed leasing activity as many properties lost marketing days due to flu-related property-level quarantines. We may potentially see a corresponding bounce back in in the second quarter as delayed move-ins from the first quarter take place”, said Beth Burnham Mace, chief economist of NIC.
Seniors housing annual absorption was 2.1% as of the first quarter of 2018, down 0.2 percentage point from the fourth quarter of 2017 and down 0.4 percentage point from one year earlier. The seniors housing annual inventory growth rate in the first quarter of 2018 was 3.1%, unchanged from the fourth quarter.
“There remains a wide range of inventory growth rates across the Primary Markets, as 5 of the top 31 metropolitan markets alone accounted for 35%—more than one-third—of the seniors housing units that came online during the past four quarters,” said Chuck Harry, NIC’s chief of Research & Analytics. “That represented annual inventory growth rates of 5.5% or greater within each of those 5 markets, with the Houston metropolitan market again having registered the highest rate at 8.0%, or two-and-a-half times that of the aggregate Primary Markets. During those same four quarters, 5 other metropolitan markets saw annual inventory growth of less than 0.25%,” added Harry.
Preliminary data on construction as a share of existing inventory for seniors housing was 6.7% in the first quarter of 2018 and was 0.3 percentage point below its recent high of 7.0% in the third quarter of 2016.
Seniors housing construction starts within the 31 Primary Markets during the first quarter of 2018 preliminarily totaled 3,832 units, which included 2,373 independent living units and 1,459 assisted living units. On a preliminary four-quarter basis, starts totaled 22,087 units. Construction starts data is often revised retrospectively in subsequent quarters as additional information becomes available.
During the first quarter of 2018, the average rate of seniors housing’s annual asking rent growth was 2.3%, down 0.2 percentage point from the prior quarter and down from a recent high of 3.7% in the fourth quarter of 2016. For comparison purposes, labor expense growth as measured by the annual change in assisted living average hourly earnings was 5.0% in the fourth quarter, according to the Bureau of Labor Statistics.
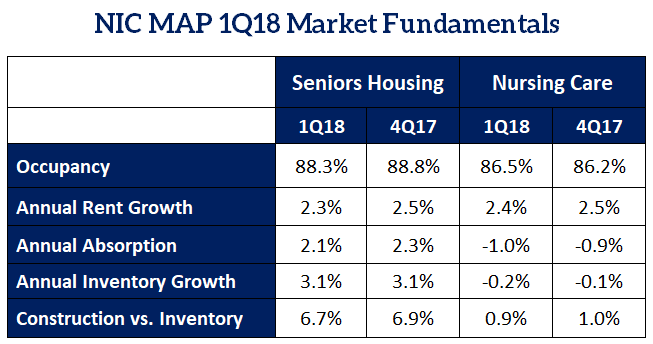
The nursing care occupancy rate increased to 86.5% in the first quarter of 2018 from 86.2% in the fourth quarter of 2017. The nursing care annual inventory growth rate was -0.2% in the first quarter of 2018, while annual absorption was down by -1.0%. Private pay rents for the sector grew 2.4% year over year this quarter, down 0.4 percentage point from year-earlier levels.
A summary of the NIC MAP Data Market Fundamentals for 1Q18 is below. Additional details and a downloadable report can be found at http://www.nic.org/nic-map/reports.
[Note: For 1Q18 NIC MAP data specific to your local metro market, please refer to the regional key metrics charts.]
[BTN href=”http://info.nic.org/1q18-abridged-presentation-download” title=”1Q18 Abridged Presentation LP” color=”PRIMARY” icon=”icon-plus-sign”]Download Abridged Presentation Now[/BTN]
About NIC
The National Investment Center for Seniors Housing & Care (NIC) is a 501(c)3 organization established in 1991 whose mission is to enable access and choice by providing data, analytics, and connections that bring together investors and providers. For more information, visit natinvcenterdv.wpengine.com, and follow NIC on Twitter.