Senior housing posted a positive total return of 2.88% in the third quarter of 2025, bringing year-to-date returns to 7.00%, the highest NCREIF property type return for both the third quarter and year-to-date performance. Senior housing in the third quarter outperformed the broader Expanded NCREIF Property Index (NPI) by 166 basis points, with the index posting a total return of 1.22%. Senior housing capital appreciation in the third quarter was positive with valuations increasing 1.50%. The capital appreciation return is the change in value net of any capital expenditures incurred during the quarter. Senior housing income return in the third quarter was also positive, yielding 1.38%. For the broader NPI in the third quarter, both capital appreciation (+0.06%) and income yield (+1.16%) were lower than senior housing but still positive.
By senior housing property subtype, independent living (+3.11%) outperformed assisted living (+2.66%) in the third quarter. In recent years, independent living has also outperformed assisted living over the one-, three-, and five-year periods. This outperformance may be driven by higher margins typically generated in lower acuity settings such as independent living, which require less staffing and labor expenses than higher acuity settings such as assisted living. Additionally, independent living has had higher occupancy rates over the five-year period, which surpassed 90% in the third quarter. Over the longer run, since NCREIF began tracking returns data for these subtypes roughly a decade ago, both assisted living and independent living posted similar average returns of more than 5.7% annually.
Annualized Total Returns by NCREIF Property Subtype
As of 9/30/2025; Unlevered

Note: Since Inception is 2014 for Assisted Living and 2016 for Independent Living
Source: NCREIF, 3Q 2025, Unlevered Annualized Total Returns
Compared to other NCREIF property types over the one-year period, senior housing was also the strongest performer, returning 9.21% and outperforming the NPI by nearly 450 basis points. Over the 10-, 15-, and 20-year periods, senior housing was the third strongest property type behind industrial and self-storage, outperforming the NPI on an annualized basis by 66, 68, and 262 basis points, respectively. Since the 2003 inception of NCREIF’s senior housing historical series, income yield drove roughly 60% of senior housing total returns, while price appreciation contributed roughly 40%. These performance measures reflect the returns of 213 senior housing properties valued at $12.68 billion in the third quarter. Overall, the number of senior housing properties tracked within the NPI has grown significantly from the 56 properties initially tracked in 2003.
Annualized Total Returns by NCREIF Property Type
As of 9/30/2025; Unlevered
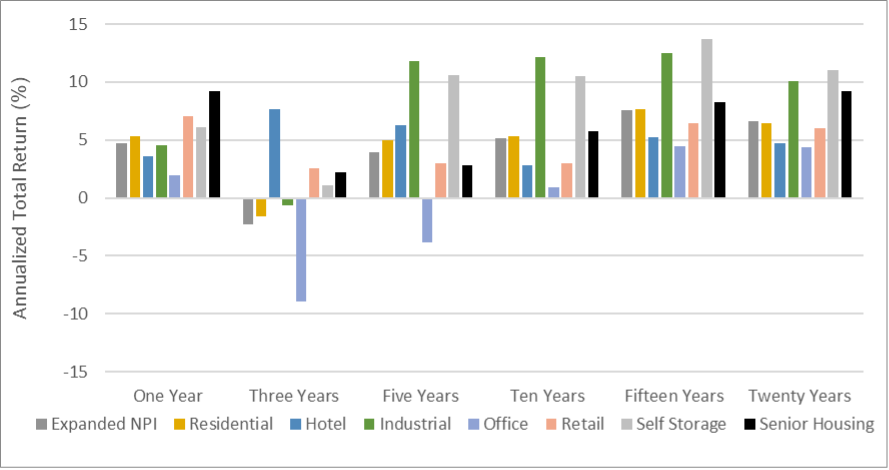
Source: NCREIF, 3Q 2025, Unlevered Annualized Total Returns
Senior Housing Total Returns by Income Yield versus Price Appreciation
As of 9/30/2025; Unlevered
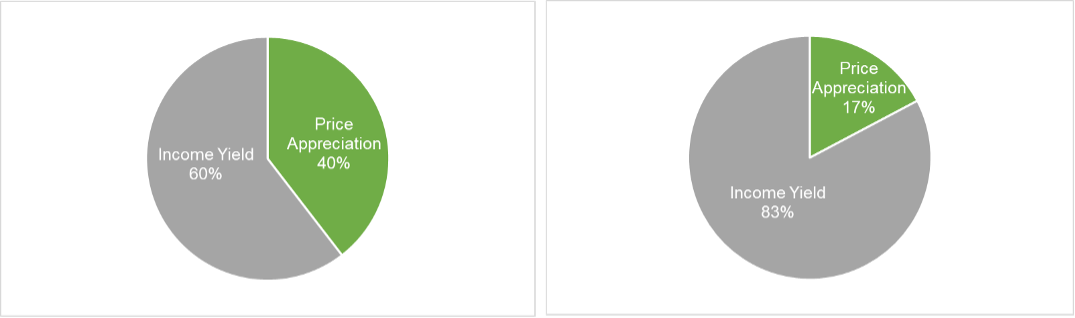
Source: NCREIF, 3Q 2025, Unlevered Annualized Total Returns
Senior housing occupancy rates in the third quarter continued climbing, with independent living surpassing 90% occupancy and assisted living jumping nearly one full percentage point to more than 87% occupied. Occupied senior housing units reached another record high, while year-over-year inventory growth fell to new record lows since NIC MAP began tracking this data in 2006. New supply is expected to remain moderate in the near term as the number of units under construction has fallen to levels last seen in 2012. Looking ahead, as a result of these robust market fundamentals, occupancy rates are on track to reach new record highs in 2026.
| TOTAL RETURN | ||||
|---|---|---|---|---|
| NCREIF Property Index (NPI) | Senior Housing | Assisted Living | Independent Living | |
| 3Q 2025 | 1.22 | 2.88 | 2.66 | 3.11 |
| YTD | 3.76 | 7.00 | 6.02 | 8.04 |
| One Year | 4.72 | 9.21 | 7.62 | 10.99 |
| Three Years | -2.31 | 2.20 | 0.63 | 4.07 |
| Five Years | 3.92 | 2.83 | 1.55 | 4.37 |
| Ten Years | 5.12 | 5.78 | 5.20 | N/A |
| Fifteen Years | 7.58 | 8.26 | N/A | N/A |
| Twenty Years | 6.62 | 9.24 | N/A | N/A |
| INCOME | ||||
|---|---|---|---|---|
| NCREIF Property Index (NPI) | Senior Housing | Assisted Living | Independent Living | |
| 3Q 2025 | 1.16 | 1.38 | 1.43 | 1.34 |
| YTD | 3.57 | 4.14 | 4.21 | 4.10 |
| One Year | 4.78 | 5.50 | 5.56 | 5.47 |
| Three Years | 4.54 | 4.65 | 4.30 | 5.10 |
| Five Years | 4.38 | 4.15 | 3.73 | 4.67 |
| Ten Years | 4.50 | 4.80 | 4.62 | N/A |
| Fifteen Years | 4.90 | 5.46 | N/A | N/A |
| Twenty Years | 5.17 | 5.91 | N/A | N/A |
| APPRECIATION | ||||
|---|---|---|---|---|
| NCREIF Property Index (NPI) | Senior Housing | Assisted Living | Independent Living | |
| 3Q 2025 | 0.06 | 1.50 | 1.23 | 1.77 |
| YTD | 0.19 | 2.78 | 1.76 | 3.84 |
| One Year | 0.06 | 3.56 | 1.98 | 5.30 |
| Three Years | -6.62 | -2.37 | -3.55 | -0.99 |
| Five Years | -0.45 | -1.27 | -2.12 | -0.29 |
| Ten Years | 0.60 | 0.95 | 0.57 | N/A |
| Fifteen Years | 2.59 | 2.70 | N/A | N/A |
| Twenty Years | 1.39 | 3.20 | N/A | N/A |
Source: NCREIF, 3Q 2025, Unlevered Annualized Total Returns