Since its founding as a 501(c)(3) organization in 1991, NIC has consistently sought to deliver on its mission of enabling access and choice in seniors housing and care by attracting and educating private sector capital, especially institutional capital (primarily pension funds and endowments), about the demand for and investment opportunities in seniors housing and care. As healthcare transformation progresses, data and analytics is becoming critically important to provide insights to all stakeholders within the continuum of care including seniors housing and care.
Health Datapalooza is an annual event which prides itself on sitting at the nexus of ideas, evidence and execution. It is more than just a meeting, however. It is an event that convenes a diverse group of strategic thinkers and problem solvers who share a mission to deliberate on and consider new ways to use data to improve health and healthcare. And we’re happy to announce that NIC will be part of the discussion at Health Datapalooza, April 26- 27, in Washington, D.C.
NIC’s Datapalooza presentation will show how reliable data has created the needed transparency that allows capital to flow into the seniors housing and care sector. Essential to this effort has been the provision of data that delivers transparency of operational, financial and investment performance comparable to other commercial real estate sectors. The result of these and other initiatives is that the seniors housing and care property sector is now an established investment category that attracts significant capital from institutional investors.
In a new effort, NIC is focusing additional attention on the middle market or middle-income senior population. Our goal initially is to generate interest from investors, researchers, and policymakers regarding the size of this opportunity. The middle market is defined as the population of seniors who are too wealthy to qualify for government-supported housing and care (primarily Medicaid), but who often cannot afford today’s private pay housing and care options.
NIC’s middle-market study will include quantitative research that measures current and future demographic, socio-economic, health and care need characteristics of middle-income seniors. This data will help attract and educate private sector capital, thereby creating the investment case for middle-market seniors housing. The research will be based on data from the Health and Retirement Survey (HRS), and is being conducted by NORC at the University of Chicago.
This study is very important since the housing setting is emerging as the platform to manage and coordinate the delivery of health services and there is a growing recognition of the crucial role played by housing—including seniors housing—to health outcomes. The research is expected to be completed by year-end 2018, with results shared at a 2019 Policy Summit in Washington D.C., and an Investment Summit in New York City.
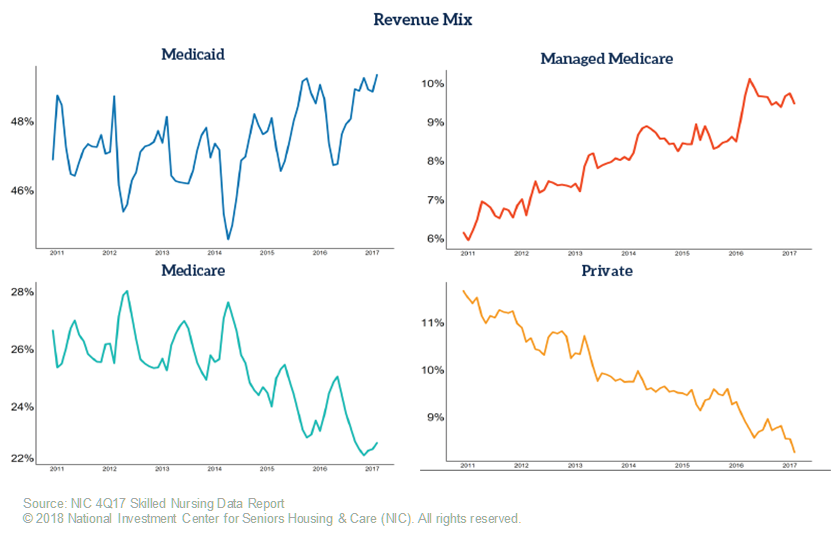
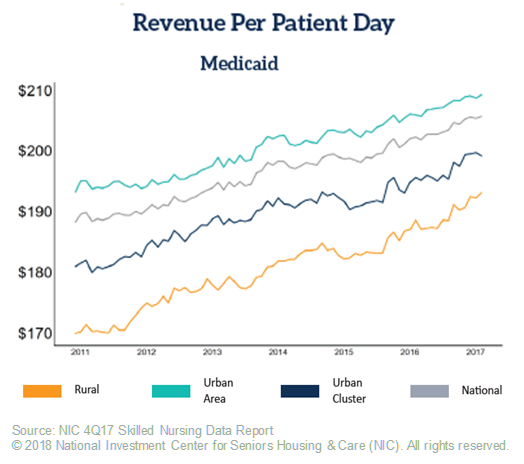
In addition, NIC’s Datapalooza presentation will highlight the need for useful, accurate, and consistent data for the skilled nursing sector. There is a significant need for capital in the sector which is undergoing tremendous change. The sector needs capital for continued real estate infrastructure improvements and operational enhancements and innovations, but institutional investment capital requires timely data. Many sources have plentiful data points, including government data sources, but the data is old, and with a sector changing so rapidly, many investors do not find much utility in such data. At the conference, NIC will highlight the monthly data it collects including the managed Medicare data which is vital to operational and investment decisions given the growth of Medicare Advantage.
Lastly, and consistent with data and collaboration, NIC will discuss the importance of quality metrics and its recently announced partnership with PointRight, a national data and analytics provider that has been delivering leading business intelligence and predictive analytics solutions to thousands of post-acute providers, hospitals and payers since 1995. Through NIC’s partnership with PointRight, NIC MAP Data Service subscribers will have access to the following PointRight reports at both the metro and property levels:
- PointRight® Pro 30® Adjusted Rehospitalization Rate
- PointRight® Pro Long Stay™ Adjusted Hospitalization Rate
- CMS Overall 5-Star Rating
- CMS 5-Star Sub-Scores
For more information about 2018 Health Datapalooza, you can visit: http://www.academyhealth.org/events/site/2018-health-datapalooza