The following analysis examines broader occupancy trends, year-over-year changes in inventory, and same-store asking rent growth – by care segment – within 1,049 entrance fee and rental CCRCs in the 99 NIC MAP Primary and Secondary Markets.
3Q 2025 Market Fundamentals by Care Segment – Entrance Fee vs. Rental CCRCs
The exhibit below compares the market performance of entrance fee CCRCs and rental CCRCs by care segment for the third quarter of 2025, highlighting year-over-year (YOY) changes in occupancy, inventory, and asking rent growth.
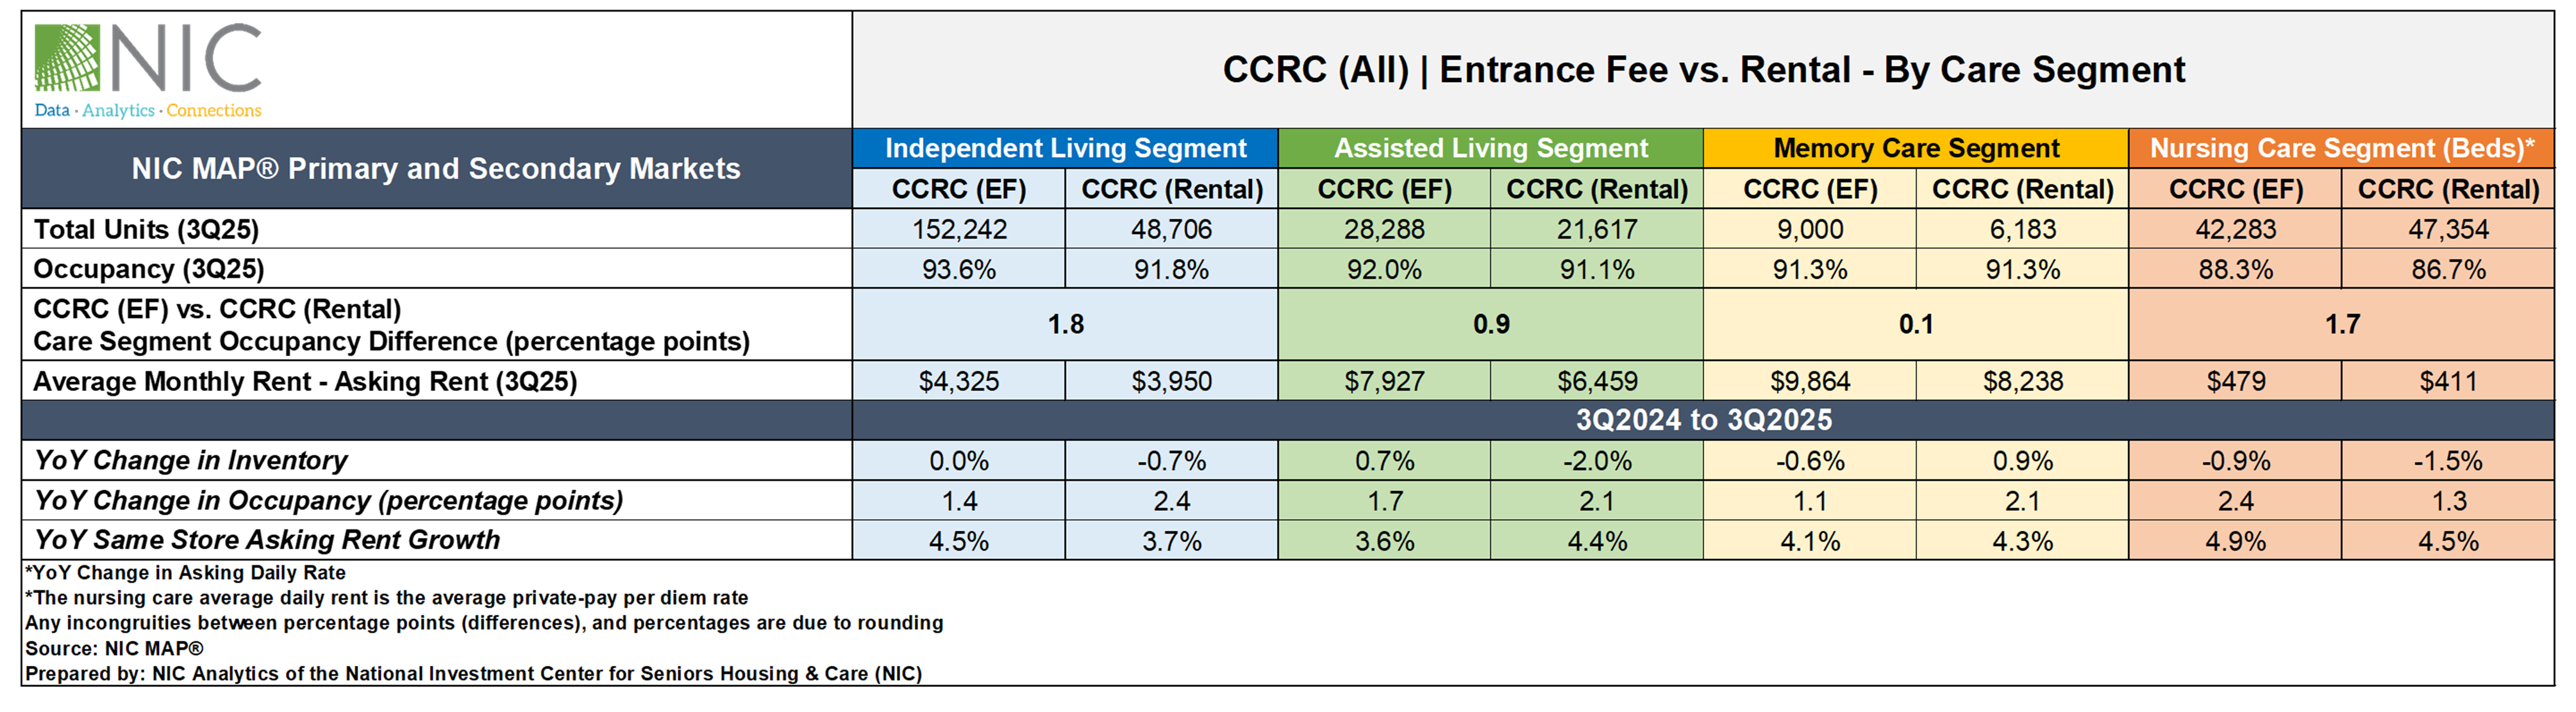
Occupancy. Entrance fee CCRCs continued to report higher occupancy rates than rental CCRCs across all care segments. Among entrance fee CCRCs, the independent living segment achieved the highest occupancy at 93.6%. Similarly, within rental CCRCs, independent living reported the strongest performance with a 91.8% occupancy rate.
The difference in occupancy rates between entrance fee CCRCs and rental CCRCs was largest in the independent living segment (1.8pps), followed by nursing care (1.7pps) and assisted living (0.9pps), with the smallest gap seen in the memory care segment (0.1pps).
Rental CCRCs recorded the higher YOY occupancy growth in independent living (2.4pps), assisted living (2.1pps), and memory care (2.1pps) segments. While entrance fee CCRCs showed higher YOY occupancy growth in the nursing care (2.4pps) segment.
Asking Rent. The average monthly asking rent for entrance fee CCRCs remained higher than that of rental CCRCs across all care segments. Rental CCRCs showed higher YOY rent growth in assisted living (4.4% to $6,459) and memory care (4.3% to $8,238) segments. Entrance fee CCRCs experienced stronger YOY rent growth in independent living (4.5% to $4,325) and nursing care (4.9% to $479*) segments.
Note, these figures represent asking rates and do not reflect any discounts that may be applied. The nursing care average daily rent is the average private pay per diem rate.
Inventory. Compared to the level a year ago, rental CCRCs experienced inventory decline across all care segments except for memory care, which showed a modest gain (0.9%). The largest decline was observed in the assisted living segment (-2.0%), followed by nursing care (-1.5%) and independent living (-0.7%) segments.
In contrast, entrance fee CCRCs displayed a mixed trend: assisted living recorded the largest YOY inventory increase (0.7%), the nursing care segment experienced the largest decline (-0.9%), while independent living segment inventory remained unchanged from the prior year.
Negative inventory growth can occur when units or beds are temporarily or permanently taken offline or converted to another care segment, offsetting any newly added supply.
Steady Increases in CCRC Entrance Fees
The exhibit below explores the average entrance fees and YOY entrance fee growth across 99 NIC MAP primary and secondary markets from 2020 through 2025. The bar chart illustrates the average entrance fee in dollar amounts, while the line graph depicts the YOY entrance fee growth rate.
The average entrance fees in CCRCs have risen steadily over the past five years. In 2020, the average entrance fee was approximately $400,000, increasing to about $430,000 by 2022 and surpassing $480,000 by 2025. Overall, the average entrance fee in CCRCs has increased by $88,386 during this five-year period, representing a cumulative growth of 22.3%. As background, over the same five-year period, the median sales price of houses sold in the United States has risen cumulatively by 29.5%, according to data from FRED. This reflects continued demand for entrance fee-based CCRCs, as the cost to enter these communities gradually climbed year after year.
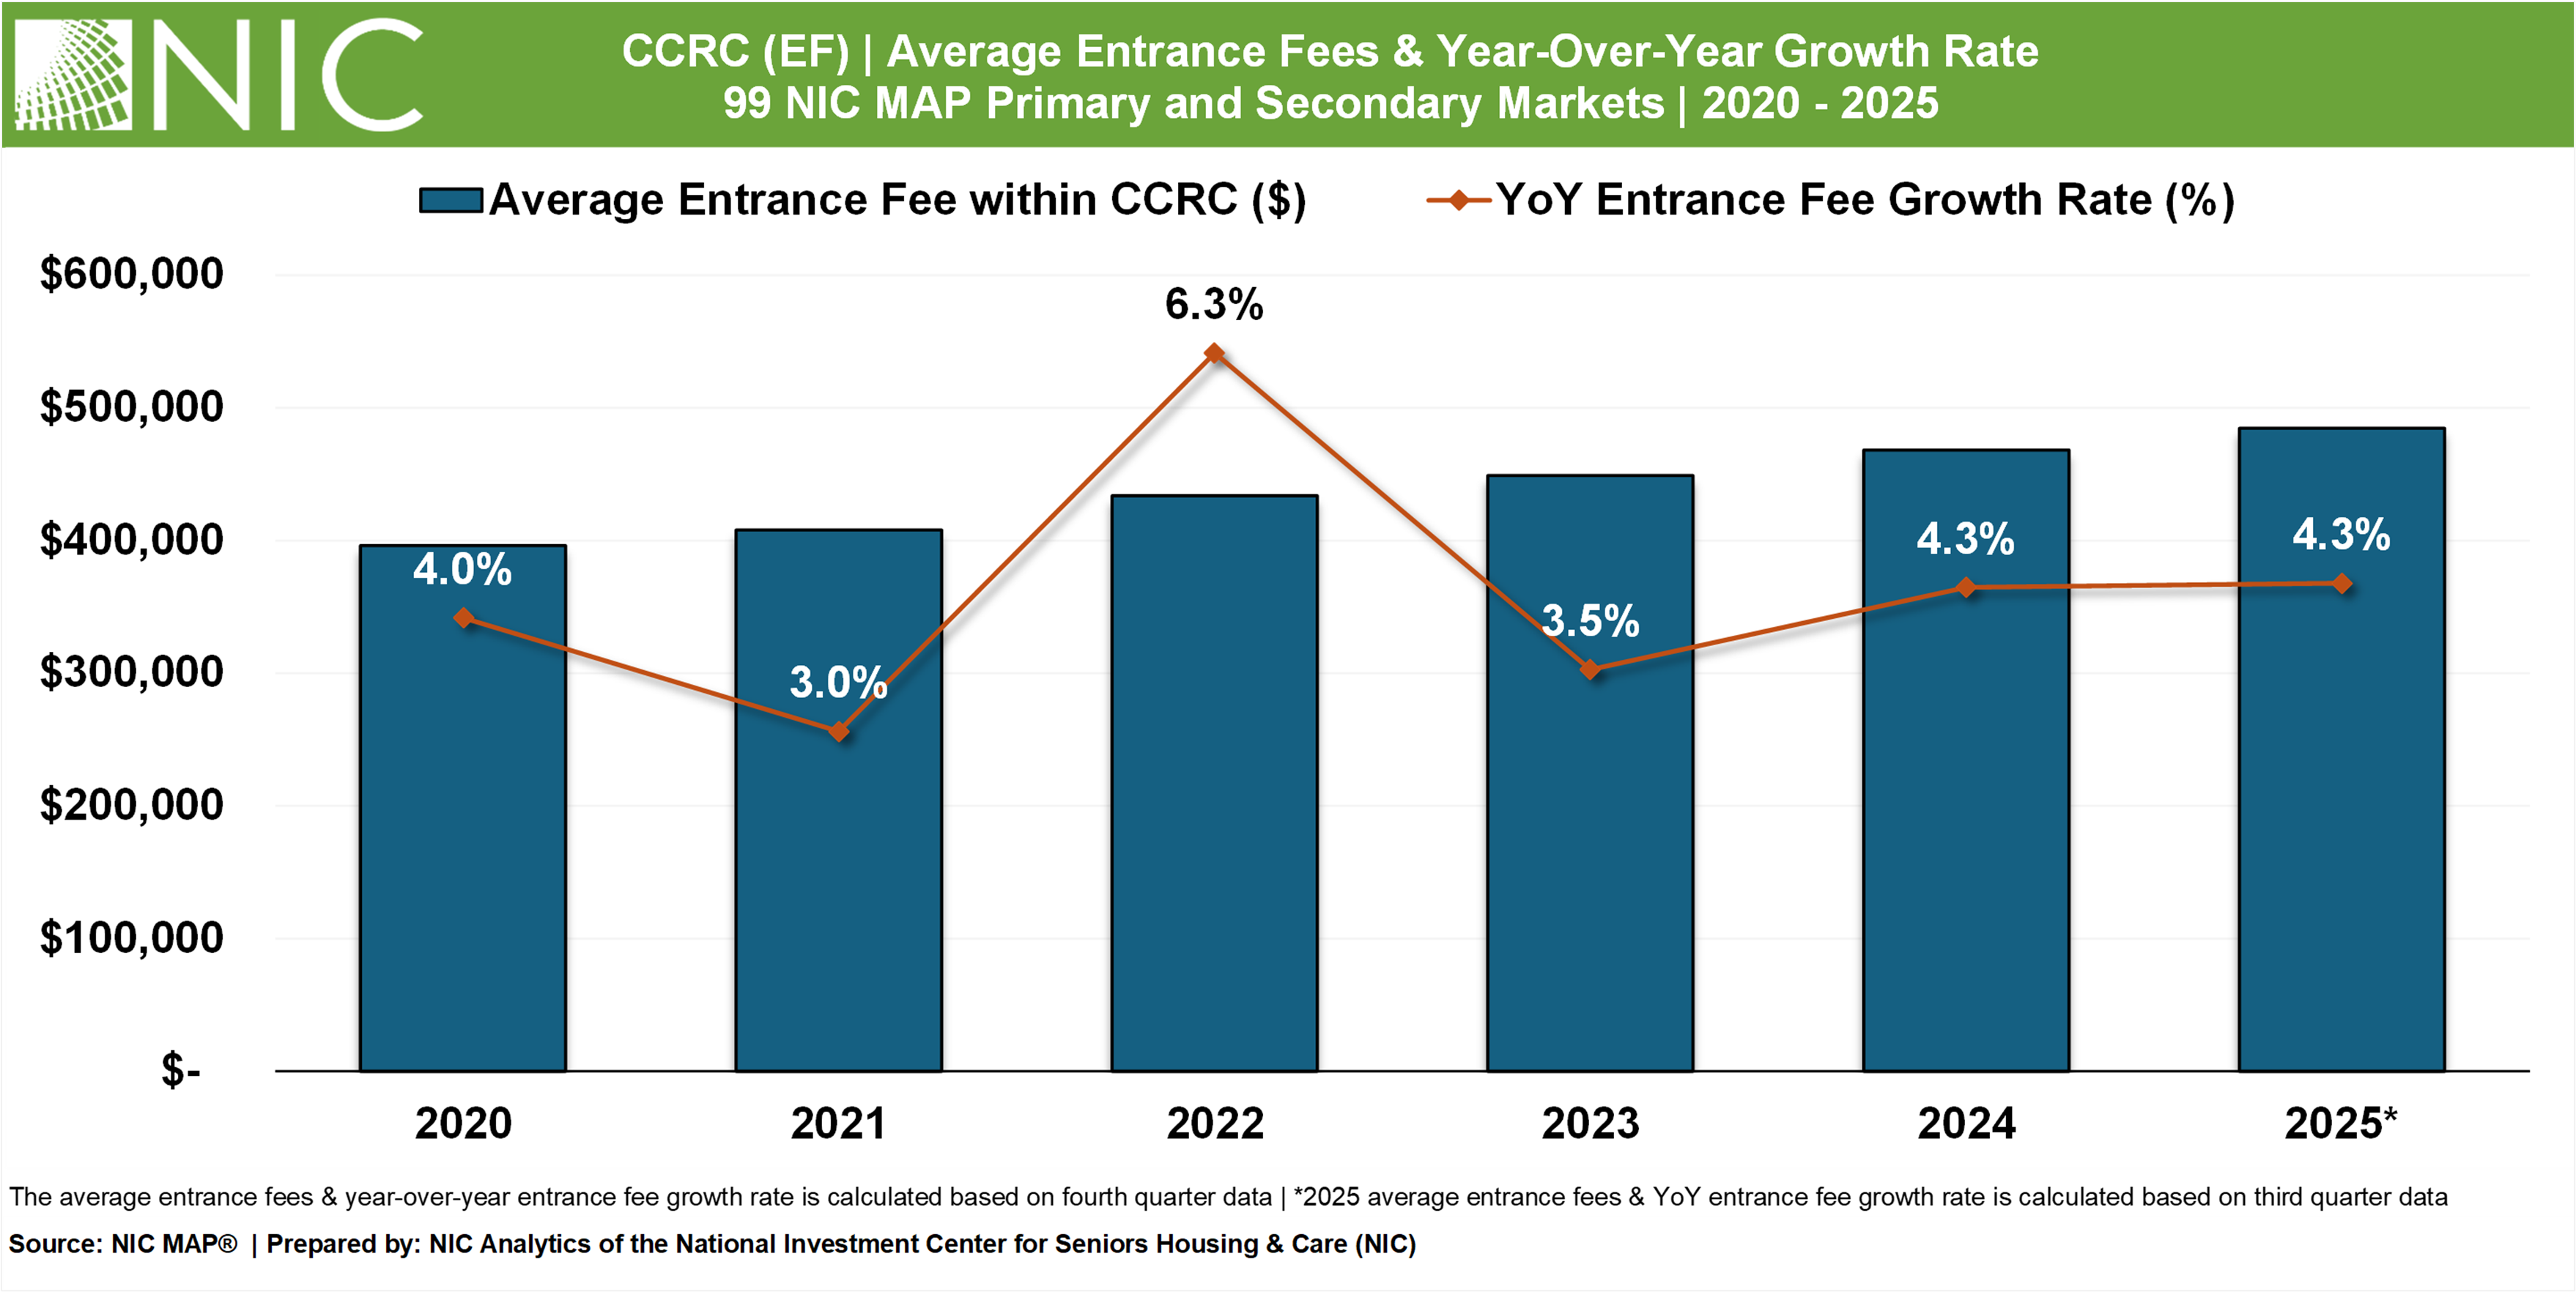
The YOY entrance fee growth rate in CCRCs fluctuated during the period. The orange line in the exhibit above highlights annual percentage growth rates, with the growth rate peaking at 6.3% in 2022, indicating a notable jump in costs that year. This was followed by a moderation in growth, with rates easing to 3.5% in 2023, rising slightly to 4.3% in 2024, and maintaining the growth at 4.3% in 2025. These changes suggest that the pace of growth has varied, potentially influenced by market dynamics, consumer demand, and broader economic conditions.
Look for future articles from NIC to delve into the performance of CCRCs.