5 Key Takeaways from NIC MAP 3rd Quarter 2021 Seniors Housing Webinar
NIC MAP Vision clients, with access to NIC MAP® Data, attended a webinar in mid-October on key seniors housing data trends during the 3rd quarter of 2021.
Seniors Housing Market Fundamentals Show Improvement in Demand.
NIC MAP Vision clients, with access to NIC MAP® data, attended a webinar in mid-October on key seniors housing data trends during the third quarter of 2021.Findings were presented by the NIC Analytics research team. Key takeaways included the following:
Takeaway #1:Record High Demand in 3Q 2021
Demand, as measured by the change in occupied inventory or net absorption, rebounded in the third quarter of 2021, increasing by 12,318 units in the Primary Markets, the strongest unit increase since NIC MAP Vision began reporting the data in 2005. Prior to the third quarter, the strongest quarterly increase occurred in the third quarter of 2019 (5,242 units). Combined with the second quarter (3,364 units), net absorption has increased by 15,682 units.
Notably, this is a clear reversal from the loss of 42,344 units during the pandemic in the second, third, and fourth quarters of 2020 and the first quarter of 2021.
As a result of greater net absorption, the total number of occupied units were close to its year-earlier level in the third quarter of 2020.
Takeaway #2: Occupancy Increased for Both Independent Living and Assisted Living in 3Q 2021
Assisted living occupancy increased to 76.9% in the third quarter, up from its pandemic low of 75.4% in the first quarter of 2021, but still below its pre-pandemic level of 85.0% in the first quarter of 2020. Independent living occupancy increased to 83.2%, up from its pandemic low of 81.8%in the first quarter of 2021 but still below its pre-pandemic level of 89.7%.
Takeaway #3: Not-for-Profits Continued to Have Higher Occupancy Rates
Not-for-profit properties consistently have higher occupancy rates than for-profits and this remained the case during the pandemic. Part of the explanation for this is that the not-for-profits often include Continuing Care Retirement Communities (CCRCs) or Life Planning Communities (LPCs) and CCRCs tend to attract residents that are younger and less frail and who typically reside in independent living often creating a longer length of stay. CCRCs also may have had more ability to segregate vulnerable populations than smaller properties.
From pre-pandemic occupancy to the low point in 1Q 2021, the occupancy rate for the for-profits fell 9.7 percentage points, a full 3.2 percentage points more than the not-for-profits. And at 86.4%, the occupancy rate for the not-for-profits was 9.1 percentage points higher than for the for-profit cohort of properties (77.4%).
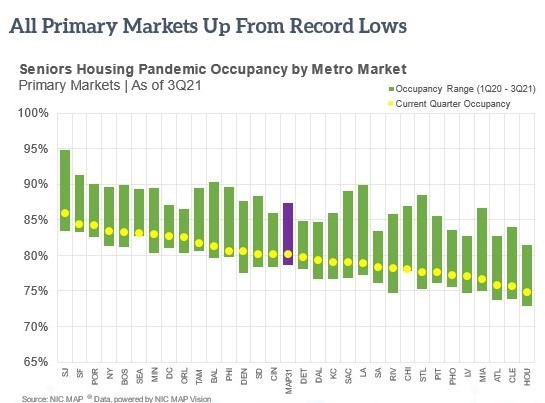
Takeaway #4: All Primary Markets Occupancy Rates Up from Record Lows
The chart below provides perspective on recovery patterns from the pandemic low by metropolitan market. The yellow dot shows the seniors housing occupancy rate in 3Q 2021, and the top of the green bar shows the 1Q 2021 occupancy rate and the bottom of the green bar shows the 1Q 2021 low point.
All markets are above their low occupancy levels. The market with the highest 3rd quarter occupancy rate was San Jose at 85.9%, followed by San Francisco, Portland, New York, and Boston. And the lowest occupied markets were Houston at 74.8%, Cleveland, Atlanta, and Miami. There is an 11.1 percentage point wide gap between the best and worst performing markets.
Regarding improvements from their respective low points, Riverside and Denver both saw a better than 3 percentage point increase in occupancy, followed by Minneapolis, Dallas, and San Jose. The smallest improvement occurred in Chicago, Seattle, and Philadelphia.
For perspective, the Primary Market occupancy rate was 80.1% and it saw a 1.4 percentage point improvement.
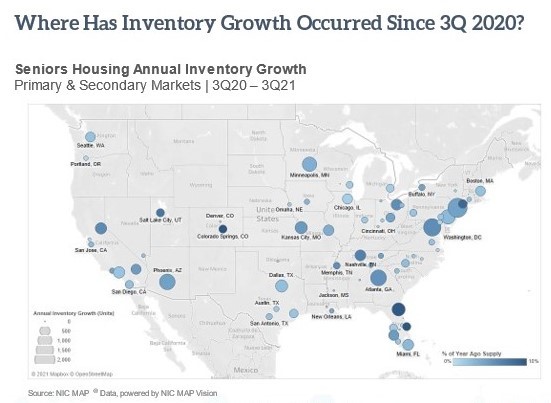
Key Takeaway #5: Where Has Inventory Growth Occurred Since 3Q 2020?
This map shows inventory growth by market for 99 markets which include the NIC MAP Primary 31 and Secondary 68 markets. The size of the circle shows the level of activity, while the color of the circle shows inventory growth relative to the size of inventory one year ago.
The largest increase in inventory from year-earlier levels as of the third quarter of 2021 occurred in New York, followed by Washington, D.C., Atlanta, Phoenix, Minneapolis, and Philadelphia, all with more than 1,000 units coming online.
Interested in learning more?
While the full key takeaways presentation is only available to NIC MAP clients with access to NIC MAP data, you can access the abridged version of the 3Q21 Data Release Webinar & Discussion featuring my exclusive commentary below.
To learn more about NIC MAP data, powered by NIC MAP Vision, an affiliate of NIC, and accessing the data featured in this article, schedule a meetingwith a product expert today.
COVID-19 Discussions with Senior Housing and Care Operators
Topics include workflow changes, testing strategies, PPE access, dementia care challenges, addressing loneliness and social isolation, and vaccines.
In March and April of 2021, researchers from the National Investment Center for Seniors Housing and Care (NIC) and the nonpartisan and objective research organization, NORC at the University of Chicago (NORC). spoke with a dozen senior housing and care operators about their experiences, challenges, and successes throughout the COVID-19 public health emergency during 2020. Discussion topics included workflow changes implemented in response to various state and federal requirements, testing strategies employed, PPE access, challenges with dementia care residents, interventions to address loneliness and social isolation, and efforts to vaccinate residents and staff.
“The collaboration and creativity between departments and team members was probably the silver lining of all of this. It knocked down a lot of silos.”
These qualitative interviews come from senior housing and care operators located in Colorado, Connecticut, Florida, Georgia, and Pennsylvania. Operators ranged in size from just a few properties to several hundred and included both for-profit and not-for profit status, freestanding and mixed-use properties, and Continuing Care Retirement Communities (CCRCs), aka Life Plan Communities. These interviews supported the quantitative analysis on COVID-19 mortality rates by care setting and allowed the research teams to better understand the context of the COVID-19 death data as well as the challenges they faced throughout the various stages of the COVID-19 pandemic and associated public health emergency.
The predominant theme from the interviews is that senior housing and care operators were incredibly agile and dedicated through the pandemic and worked 24/7 to keep residents safe while continuing to compassionately care for residents. NIC has published a selection of stories and quotes from our series of interviews to highlight the efforts that operators have successfully made to protect, safeguard, and maintain engagement with their residents and staff. Read the full white paper.
Last Chance to Register for the 2021 NIC Fall Conference
A week from today, thousands of leaders in senior housing and care will convene in person for three days of networking, deal-making, and strategic insight.
A week from today, thousands of leaders in senior housing and care will convene, in person, for three days of networking, deal-making, and strategic insight. For many, the 2021 NIC Fall Conference is the most important event of the year, particularly during a time of disruption which is presenting significant challenges – and major opportunities. Most are likely looking forward to meeting friends, old and new, in person, and to being able to return to a sense of normalcy.
Veterans of previous NIC conferences will notice some changes from past events, but will nonetheless enjoy all of the business benefits, and perks, that they have come to expect from this highly anticipated event. NIC, working closely with event health and safety leader, SafeExpo, as well as in close coordination with the management and staff of the Marriott Marquis Houston, has designed the event both to be as safe as possible, and as rewarding as ever.
No Onsite Registration
Due to safety requirements, NIC is closing registration this Thursday, October 28th, and will not offer onsite registration. It’s not too late to sign up and upload proof of vaccination – but procrastinators (you know who you are) must register now. See here for details.
Safety has dictated many decisions, including the requirement that every attendee and all NIC staff provide proof of vaccination. Numerous innovations, such as the all-day self-service NIC Café, advance mailing of credentials and PPE kits, spreading out the educational program, indoor and outdoor remote live-streaming areas, and onsite health resources, will help improve safety. NIC is even providing social distancing comfort-level buttons, so attendees can convey whether they prefer elbow bumps, hugs, or no physical contact. Masks will be strongly encouraged when attendees are not drinking or dining.
Networking
Whether meeting in hallways, educational sessions, scheduled events and meetings, or in the elevator, attendees will be ready to explore new relationships and opportunities, and to share their experiences and insights with one another. NIC has spread meeting points throughout the entire Marriott Marquis Houston, scheduled organized networking events, and provided two spacious designated networking lounges, to enable the kind of face-to-face interactions that all of us have missed so much. The NIC App provides tools for messaging, scheduling meetings, finding resources, and much more.
First-Time Attendees
First-time attendees have access to activities and resources specifically geared to help them successfully navigate the conference, including an orientation webinar, a First-time Attendee Gathering, and morning meet-ups. The special gathering, scheduled from 1-2PM Monday in the Level 6 Outdoor Event Pavilion, is both a chance to meet NIC leadership for tips and tools – and a great networking event. The morning meet-ups offer another chance to meet fellow first-timers, Tuesday and Wednesday, 8-8:30AM, in the Level 4 Texas Ballroom Foyer.
Insights
Over 50 thought leaders and experts will share their insights and their (sometimes-differing) perspectives in a ten-session educational program designed for timeliness, relevance, and impact. These include Nobel prize-winning economist Paul Krugmanand former Secretary of the U.S. Treasury Lawrence H. Summers, who will be discussing macroeconomic and capital market trends. Every session is designed to help attendees understand the latest trends, digest the latest data, and hear from the nation’s most highly regarded experts and leaders on the issues facing senior housing and care today—and the solutions of the near future.
Because sessions are non-concurrent this year, attendees will have the opportunity to attend every session, without having to choose between two or three. They may also opt to view sessions from comfortable and spacious remote live-streaming areas.
Focus Areas
Whether attendees are focused on financing or operations, the conference program offers relevant and expert insights into current market trends and innovations, as well as the disruptions facing the sector. Sessions are organized into two tracks; Managing Margins (MM), providing insights into operational strategies, property operations and management, and Realizing Returns (RR), for insights into capital markets, property investments and capital flow.
Pampering
NIC attendees love to take advantage of the many attendee resources NIC provides for their comfort, safety, and a bit of pampering. Attendees this year can swing by the LinkedIn corner to get professional help updating their online profiles, for example. They may also enjoy a casual chat over gourmet coffee, get a new headshot, or take their networking out on the town with evening car service – and find dessert waiting upon their return. If they need to take a call or get some work done, NIC has provided individual private workspaces. And if attendees have a question, need a mask, or even forgot their toothbrush, there’s a concierge desk on every level.
Know-Before-You-Go
NIC is providing attendees with resources to get the most out of the event, even before they board a flight to Houston. The NIC app is an essential tool, both for preparation and for optimizing conference resources on site. Registrants can access the attendee list ahead of time, download the program, plan their schedules, message each other, post on the social wall, and much more. The app is easy to find and download; just search for “NIC Conference” on theiTunes App Store or Google Play.
NIC provides first-time registrants with the ‘First-time Attendee Webinar,’ offering tips and insights on preparing for the conference. This year, NIC is sending registrants a special package containing their conference credential, along with a PPE kit, and even a NIC lapel pin, designed to help attendees identify and connect with each other as they travel to and from Houston. Later registrants can pick up their credential onsite.
Don’t Miss the Most Important In-Person Event of the Year
Since its founding 30 years ago, NIC has been convening industry leaders to share thought-leadership, connect with capital, improve transparency, and bring transformative innovation into the marketplace. Over time, these efforts have proven an effective means to advance NIC’s mission of enabling access and choice for America’s elders, while simultaneously helping industry leaders find pathways to success. For both of these reasons, NIC is pleased to be able to convene so many, even during this time of disruption, and to be able to present so much opportunity, as we all look forward to a bright future.
The Labor Crisis: A Ripple Effect and Dilemma for SNFs
This blog post provides a NIC Analytics review of data that highlights and quantifies the number one issue facing operators of skilled nursing facilities: staffing shortages. Labor shortages are particularly acute for nursing staff and aides.
This blog post provides a NIC Analytics review of data that highlights and quantifies the number one issue facing operators of skilled nursing facilities: staffing shortages. Labor shortages are particularly acute for nursing staff and aides who are often the hands-on workers with direct and intimate relationships with residents and patients. Staffing has generally been a challenge for the sector but since the onset of the pandemic staffing shortages have become pervasive across the industry.
Some have called the current skilled nursing labor shortage the worst the sector has ever seen, and many are worried it will intensify. To be fair, many sectors of the economy are experiencing significant labor shortages for a multitude of reasons such as a reduced pandemic-related labor force, worker fear of catching or spreading COVID-19, childcare and elder care responsibilities, and generous pandemic-related unemployment insurance benefits (many of which have recently rolled off). There is some debate about the causes of labor shortages across the country, but one thing that is certain is many sectors of the economy are being impacted in ways that are creating major operational hurdles.
Skilled nursing facilities (SNFs) face an all too familiar dilemma in competing with other industries in retaining and recruiting workers to provide care for high acuity residents. Further, the industry is challenged with maintaining operating margins due to very low occupancy rates, elevated operating expenses, and the often-inadequate Medicaid payment rates in many states.
Staffing shortages are a critical part of the much bigger story of today’s aging society. In 2020, the American population over 75 was estimated to be 23 million, according to the Bureau of Labor Statistics (BLS). By 2025, this figure will rise to 29 million (up 26% from 2020 levels), and by 2030, this figure will rise to 34 million (up 48% from 2020 levels). At the same time, other broad demographic trends suggest labor force challenges as older adults reach retirement and as they are not fully replaced by younger experienced workers.
According to the Demographic Drought Report released by EMSI, a leading provider of labor market data, “the US labor force participation rate (LFPR), which measures people working or actively seeking work, has dropped to lows we haven’t seen since the recession of the mid-1970s.” The report also highlighted the mass exodus of baby boomers and the lowest birth rates in U.S. history. Notably, the number of baby-boomer retirees increased by over a million in 2020, and the national birth rate hit a 35-year low in 2019. These demographic trends suggest a tightening labor market ahead, and that a large and growing labor pool of essential workers are needed today and in the foreseeable future.
What healthcare workers are in high need and have the biggest shortages within the skilled nursing sector?
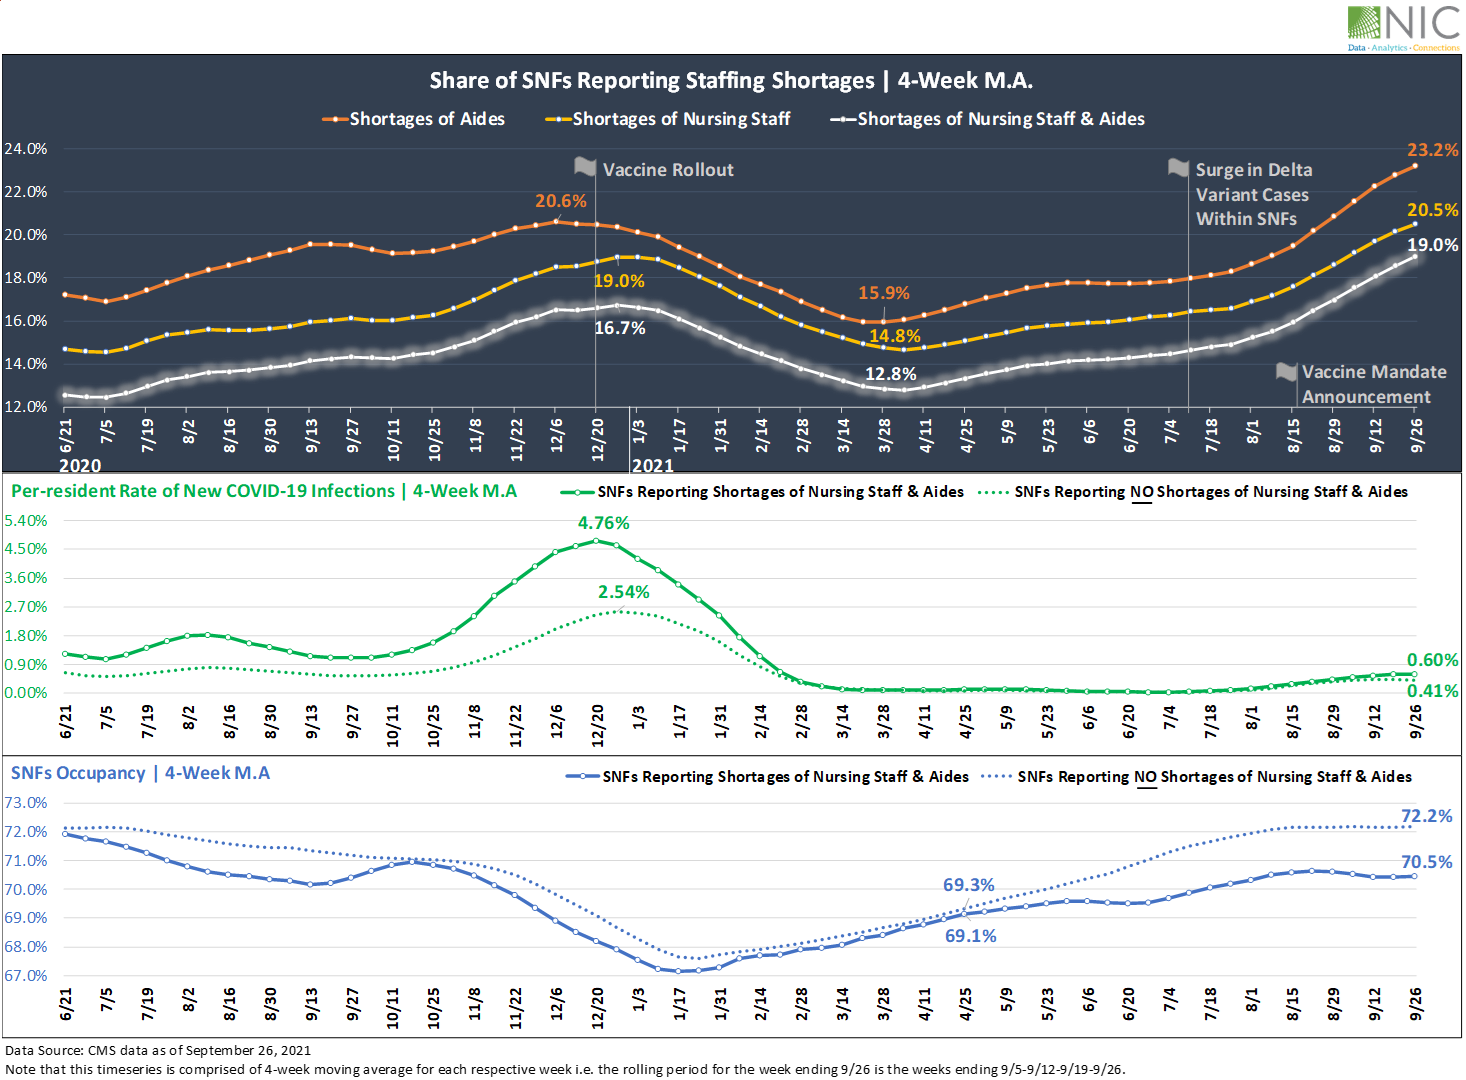
Exhibit 1 below depicts the share of skilled nursing facilities reporting shortages of nursing staff and aides since CMS began reporting this data in May 2020. The highest shortages of staff reported by SNFs have been among aides and nursing staff. Further, nursing staff and aides represent the largest share of all SNF staff. Indeed, according to the BLS Employment & Wage report compiled by NIC MAP®, powered by NIC MAP Vision, nursing staff and healthcare support occupations, including aides, represent over 60% of all staff within the skilled nursing sector.
Following the launch of the long term care vaccination program in December 2020, the share of SNFs reporting shortages of hands on essential workers started trending down and reached a low level of 15.9% for aides in March 2021, 14.8% for nursing staff and 12.8% for both nursing staff and aides. Since then, the proportion of SNFS reporting shortages began to rise again as move-ins and occupancy rates increased, although these percentages remained below the high levels seen in December 2020 prior to the vaccine rollout (20.6% for aides, 19.0% for nursing staff and 16.7% for both nursing staff and aides).
Unfortunately, a surge in COVID-19 delta variant cases within U.S. skilled nursing facilities in July 2021 as well as the recent vaccine mandate announcement in August 2021 exacerbated shortages of on-hand essential workers. By the end of September 2021, 23.2% of SNFs reported shortages of aides (up 7.3 percentage points from March 2021 levels), 20.5% reported shortages of nursing staff (up 5.7pps over the same period), and 19.0% reported shortages of both nursing staff and aides (up 6.2pps since March 2021). These are the highest levels seen since May 2020.
What impacts do shortages of nursing staff and aides have on SNF residents, SNF performance and the recovery of the sector as a whole?
Staffing shortages have likely not hit the peak yet and may get worse in the next few months. Indeed, a recent survey by the American Health Care Association and National Center of Assisted Living (AHCA/NCAL) shows nearly all the nursing homes participating in the survey are currently asking staff to work overtime or extra shifts and more than half are limiting new admissions due to staffing shortages. The survey also highlights that 78% of the nursing homes surveyed admitted to being concerned about having to close their facility due to workforce challenges.
The ripple effect on residents and the performance of SNFs is even more profound. Since CMS began reporting data in May 2020, skilled nursing facilities experiencing shortages of both nursing staff and aides have been reporting relatively higher per-resident rates of new COVID-19 infections and lower occupancy rates compared with SNFs reporting no shortages of these hands-on essential workers.
Notably, in December 2020 and prior to the vaccine rollout, infection rates peaked at 4.76% on a 4-week moving average (476 in 10,000 residents tested positive) for SNFs reporting shortages of nursing staff and aides, nearly double that of SNFs reporting NO shortages of hands-on essential workers (2.54%, equivalent to 254 in 10,000 residents tested positive). This suggests that shortages of staff translate into lower staff-to-resident ratios and consequently increase “one-to-many” interactions between available staff and residents. These “one-to-many” interactions could lead to higher virus transmission among residents.
The occupancy chart featured in Exhibit 1 below shows that SNFs reporting shortages of hands-on essential workers (in this case, defined as nursing staff and aides) have also had somewhat lower occupancy rates compared with SNFs reporting no staffing shortages since May 2020.
The widening gap in the last four months is something to watch going forward. By the end of September 2021, as staffing shortages intensified, the occupancy rate for SNFs reporting shortages of nursing staff and aides was 70.5% (4-week moving average, based on CMS data), 1.7pps below the occupancy rate for SNFs reporting no shortages (72.2%). Back in April 2021 when staffing shortages and virus cases within SNFs were relatively low, the occupancy rate for SNFs reporting shortages was 69.1%, only 0.2pps below the occupancy rate for SNFs reporting no shortages (69.3%).
The recovery in demand in the last few months is promising but staffing shortages could slow down the occupancy recovery for the sector and limit the improvement for SNFs experiencing staffing shortages.
Exhibit 1 – Staffing shortages vs. per-resident rate of new COVID-19 infections and occupancy
Staffing shortages and the impact on vaccination rates
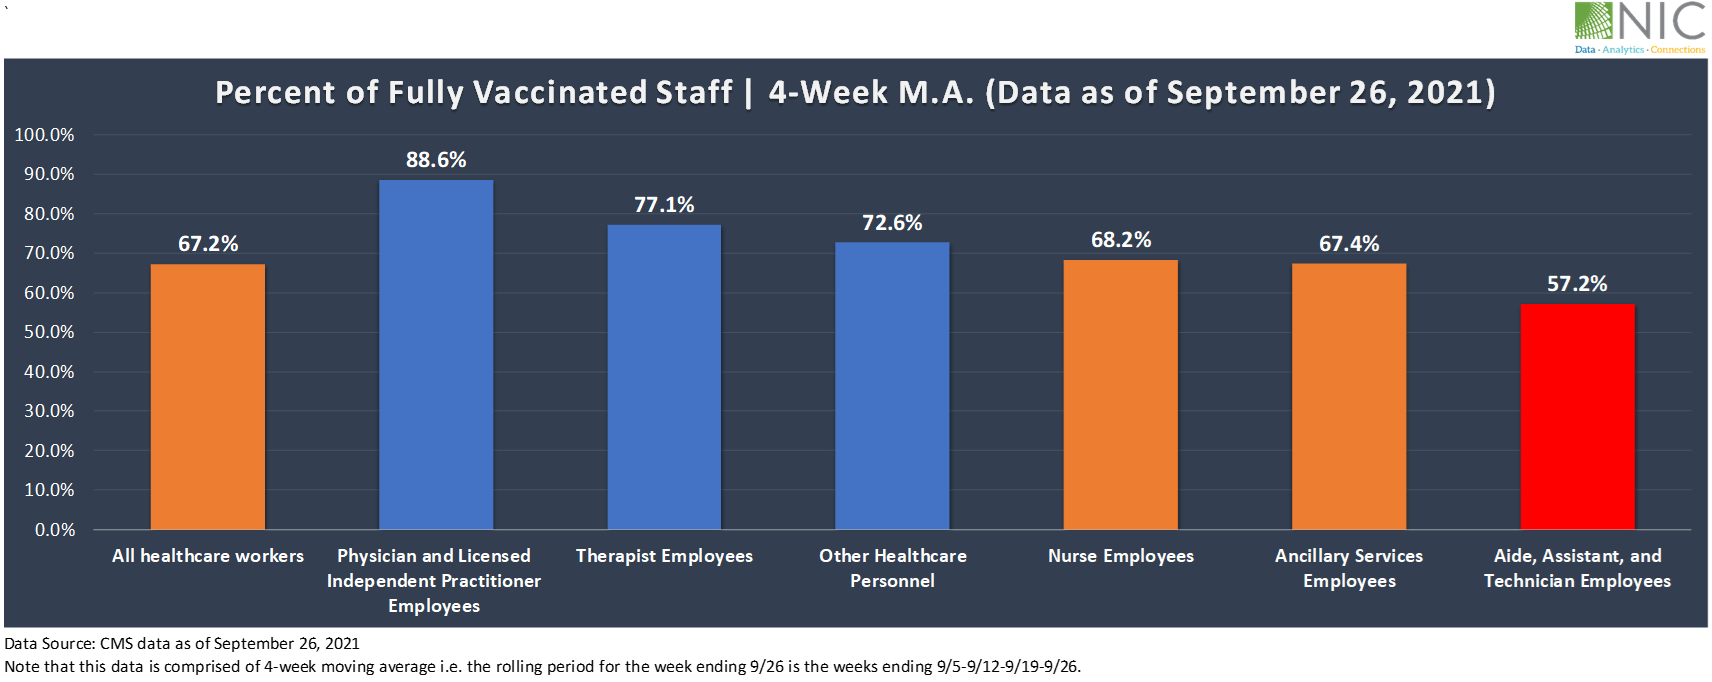
The effects of staffing shortages continue across vaccination rates, which have been relatively low among nursing staff and extremely low among aides. In September 2021, 67.2% of all healthcare workers had been fully vaccinated, up 8.7pps from 58.5% in June 2021. Vaccination coverage has certainly improved in the last three months, but the disparity in vaccination rates among healthcare workers in SNFs has been dragging down the overall vaccination rate among staff and could be leading to higher virus transmission among residents.
Exhibit 2 below shows that the highest rate of fully vaccinated staff was among licensed independent practitioners at 88.6%, followed by therapist employees (77.1%), and other healthcare personnel (72.6%). However, vaccination rates among aides are still lagging, with only 57.2% of aides having been fully vaccinated, 11pps below the vaccination rate of nursing staff (68.2%) and 10pps below the overall staff vaccination rate of 67.2%, and even below the vaccination rate of all healthcare workers recorded three months ago in June 2021 (58.5%).
Staggering as this disparity in vaccination rates among SNFs healthcare workers is, none of this comes as a particular surprise. Aides and nursing staff represent the largest number of workers within the skilled nursing sector, and both have the highest shortages and most likely the highest turnover and churn rate. Recent studies have shown high turnover and churn rate among staff at nursing homes.
Skilled nursing facilities keep recruiting and losing these critical workers. In addition to the time and effort of recruiting and training these -hands on essential workers who interact directly with patients, a higher turnover rate is likely having a significant impact on operational costs, productivity, and infection control protocols to prevent virus transmission among residents.
Exhibit 2 – Vaccination rates among SNFs workers
Shortages of nursing staff and aides vary by state
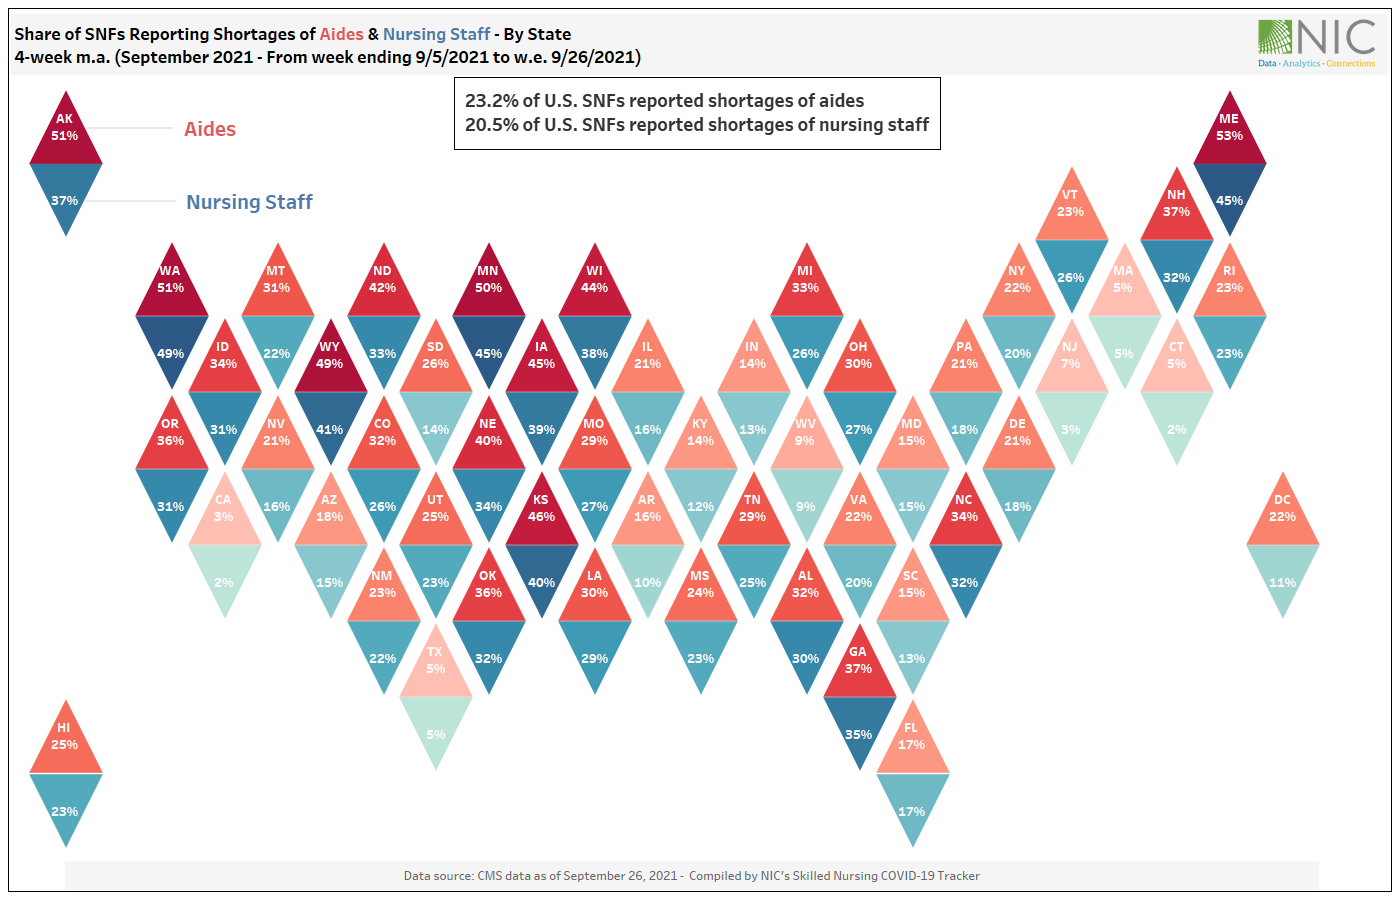
Exhibit 3 below shows that shortages of nursing staff and aides vary by state. In September 2021, over 40% of SNFs reported to be experiencing shortages of both nursing staff and aides across several states, including Maine, Kansas, Wyoming, and Minnesota.
While the majority of states are currently experiencing high staffing shortages, there are some states where staffing shortages have been comparatively very low among both nursing staff and aides. These states include California, Texas, Connecticut, New Jersey, and Massachusetts. Some of these states may have access to a larger labor pool. However, having access to a large labor pool doesn’t necessarily mean high retention rates among hands on essential workers (aides and nursing staff). Retention seems to be a real challenge facing all SNFs, regardless of labor availability.
Staff availability and retention may become the leading factors in identifying a competitive market or property for senior housing and skilled nursing constituents, and key attributes for residents in choosing between facilities.
Exhibit 3 – Share of SNFs reporting shortages of aides vs. nursing staff – By state
In this NIC analysis, we examined what group of workers and roles are in high needs and have the largest labor shortages within skilled nursing facilities, and the impact that shortages of these essential workers (aides and nursing staff) have on SNF residents, SNF performance, and the recovery of the skilled nursing sector.
Forthcoming analysis will examine what’s driving labor shortages among these critical and essential workers. and explore potential solutions and limitations to address this major issue.
Social Security Benefits to Increase Significantly in 2022
The Social Security Administration announced they will raise Social Security and Supplemental Security Income (SSI) benefits by 5.9% for approximately 70 million Americans.
The Social Security Administration announced they will raise Social Security and Supplemental Security Income (SSI) benefits by 5.9% for approximately 70 million Americans – 64 million Social Security beneficiaries and 8 million SSI recipients. This adjustment is set to take effect with benefits that Social Security beneficiaries receive beginning in January 2022.
The announced increase in benefits will mark the highest one-year bump in almost four decades. For comparison, the cost-of-living adjustment (COLA) was 1.3% in 2020 and 1.6% in 2019.
The elevated COLA comes as a result of steep price increases as the U.S. economy emerges from the COVID-19 public health emergency. The Social Security Act ties the annual COLA to the increase in the Consumer Price Index (CPI) as determined by the Bureau of Labor Statistics (BLS). The most recent BLS CPI report indicates that over the last 12 months, the all-items index increased 5.4%.
Experts caution, however, that seniors utilizing Medicare Part B will see substantially less than the 5.9% bump, as Medicare Part B premiums are expected to increase 6.7%, from $148.50 to $158.50 in 2022. Medicare Part B premiums are tied to seniors’ income and deducted from beneficiaries’ checks.
Social Security and SSI beneficiaries are normally notified by mail starting in early December about their new benefit amount. The Social Security Administration has provided a fact sheet showing the effect of the various adjustments.
We use cookies on our website to give you the most relevant experience by remembering your preferences and repeat visits. NIC's privacy policy can be viewed here. By clicking “Accept”, you consent to the use of ALL the cookies.
This website uses cookies to improve your experience while you navigate through the website. Out of these cookies, the cookies that are categorized as necessary are stored on your browser as they are essential for the working of basic functionalities of the website. We also use third-party cookies that help us analyze and understand how you use this website. These cookies will be stored in your browser only with your consent. You also have the option to opt-out of these cookies. But opting out of some of these cookies may have an effect on your browsing experience.
Necessary cookies are absolutely essential for the website to function properly. This category only includes cookies that ensures basic functionalities and security features of the website. These cookies do not store any personal information.
Functional cookies help to perform certain functionalities like sharing the content of the website on social media platforms, collect feedbacks, and other third-party features.
Performance cookies are used to understand and analyze the key performance indexes of the website which helps in delivering a better user experience for the visitors.
Analytical cookies are used to understand how visitors interact with the website. These cookies help provide information on metrics the number of visitors, bounce rate, traffic source, etc.
Advertisement cookies are used to provide visitors with relevant ads and marketing campaigns. These cookies track visitors across websites and collect information to provide customized ads.