Expanding on a recent blog post that detailed care segment performance in the Primary Markets since the most recent market cycle peak that was reached in the fourth quarter of 2014 for the seniors housing and care segments, this analysis goes a step further by considering the market fundamentals of segments within continuing care retirement communities (CCRC segments), compared to non-CCRC segments in freestanding or combined communities. Also referred to as life plan communities, CCRCs offer multiple care segments (at minimum independent living and nursing care) typically by a single provider on one campus, and this analysis breaks the segments apart from the CCRC community type that NIC includes under the main category of Seniors Housing.
With the objective of making “apples to apples” comparisons, this data is useful for understanding the relative performance of care segments within CCRCs. In order to conduct the analysis, data was mined for 4Q2014 to 2Q2018 (the period under study) from the NIC MAP database for both CCRC entrance fee (EF) and rental payment types (note that 98.8% of Non-CCRC segments were rental). Although NIC MAP recently released 3Q2018 data, to be consistent with the prior blog post on which this analysis builds, 2Q2018 data is referenced.
For context, the seniors housing fundamentals in the Primary Markets since the first quarter of 2006 through the second quarter of 2018 showed peak and near-peak occupancy rates were reached in the quarters leading up to the Great Recession, and more recently, in the second half of 2014, when the occupancy rate hovered around 90% for several quarters. In the beginning of 2016 the seniors housing occupancy rate began a 10-quarter decline as inventory growth outpaced absorption, falling to 87.9% as of the second quarter of 2018. This was the lowest occupancy rate in seven years.
As previously reported, while all segments within the seniors housing category saw declines in occupancy for the period 4Q2014 to 2Q2018 due to inventory growth outpacing absorption, the independent living segment performed the best in terms of occupancy and average annualized asking rent growth. The memory care segment had the weakest comparative performance, overall, with the strongest change in inventory, which put pressure on the segment’s occupancy rates and rent growth.
This analysis goes a step further: CCRCs and Non-CCRCs
Occupancy 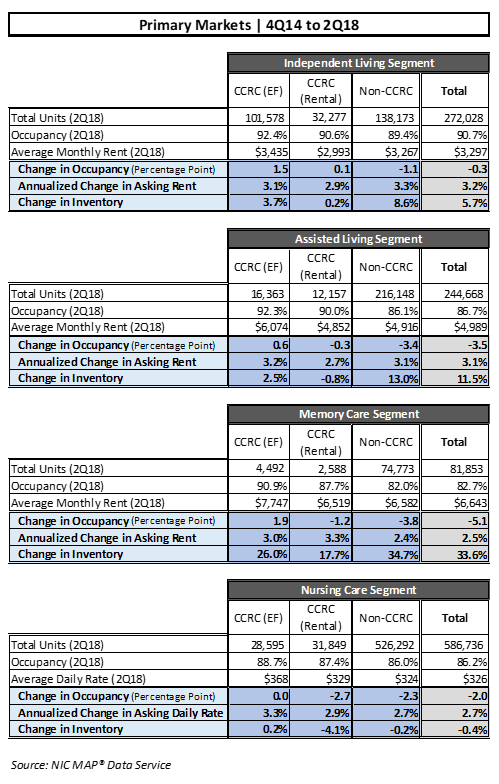
Across all segments, entrance fee CCRCs (CCRC EF in the tables) had stronger occupancy growth rates than rental CCRCs or non-CCRCs for the period under study (4Q2014 to 2Q2018).
The memory care and independent living segments in entrance fee CCRCs had the highest rates of occupancy growth, (1.9 and 1.5 percentage points, respectively). The weakest rates of occupancy growth were reported for the non-CCRC memory care and assisted living segments (-3.8 and -3.4 percentage points, respectively). Non-CCRCs, in general, had weaker occupancy growth rates by segment than CCRCs, but rental CCRCs performed worse than non-CCRCs in the nursing care segment in terms of occupancy.
In the second quarter of 2018, CCRCs had higher occupancy levels than non-CCRCs, and entrance fee CCRCs had higher occupancy levels than both rental CCRCs and non-CCRCs.
Inventory
In the Primary Markets, CCRCs account for 49% of the total independent living units, 12% of the total assisted living units, 9% of the total memory care units, and 10% of the nursing care beds.
Non-CCRCs generally had higher rates of inventory growth by segment than CCRCs, and entrance fee CCRCs had stronger rates of inventory growth than rental CCRCs. The highest rate of inventory growth was reported for non-CCRCs in the memory care segment (34.7%). The weakest was reported for the nursing care segment of rental CCRCs (-4.1%).
Asking Rent
Non-CCRCs and entrance fee CCRCs had slightly stronger average annualized asking rent growth by segment for the period than rental CCRCs in independent living and assisted living, and rental CCRCs had slightly stronger average annualized asking rent growth for memory care.
The strongest average annualized rent growth (3.3%) was noted for entrance fee CCRCs in the nursing care segment, rental CCRCs in the memory care segment, and non-CCRCs in the independent living segment. Non-CCRCs saw the weakest average annualized rent growth in the memory care segment (2.4%). Entrance fee CCRCs reported stronger average annualized asking rent growth in nursing care and assisted living than rental CCRCs or non-CCRCs.
In summary:
- Non-CCRC segments, in general, had weaker occupancy levels and growth rates than CCRCs. This may be because non-CCRCs had generally higher rates of inventory growth by segment.
- Entrance fee CCRCs generally had stronger occupancy growth rates by segment than rental CCRCs and non-CCRCs, and also had higher rates of inventory growth than rental CCRCs.
- Non-CCRCs and entrance fee CCRCs had stronger average annualized asking rent growth by segment for the period than rental CCRCs in independent living and assisted living. The strongest average annualized rent growth was noted for entrance fee CCRCs in the nursing care segment, rental CCRCs in the memory care segment, and non-CCRCs in the independent living segment.
Look for future blog posts from NIC to delve deep into the relative performance of care segments within CCRCs. This analysis, not available elsewhere, will be a continuing feature.