NIC MAP® Data Service clients attended a webinar in mid-July on the key seniors housing data trends during the second quarter of 2018. Key takeaways included the following:
Takeaway #1: Seniors housing occupancy fell to 87.9%
- The all occupancy rate for seniors housing, which includes properties still in lease up was 87.9% in the second quarter, down 40 basis points from 88.3% in the first quarter of 2018, and down 80 basis points from the second quarter of 2017. This was the lowest occupancy rate in seven years or since 2Q 2011. Meanwhile, assisted living occupancy fell to a record low rate of 85.2% in the second quarter.
- The quarterly decline in the occupancy rate stemmed from a significant increase in inventory in the second quarter—6,492 units. This was the largest unit increase in inventory since NIC began reporting the data in 2006. This in turn can be traced to gains in assisted living inventory which also registered the largest increase in unit inventory in the time series. Independent living inventory also increased, but it did not set a record.

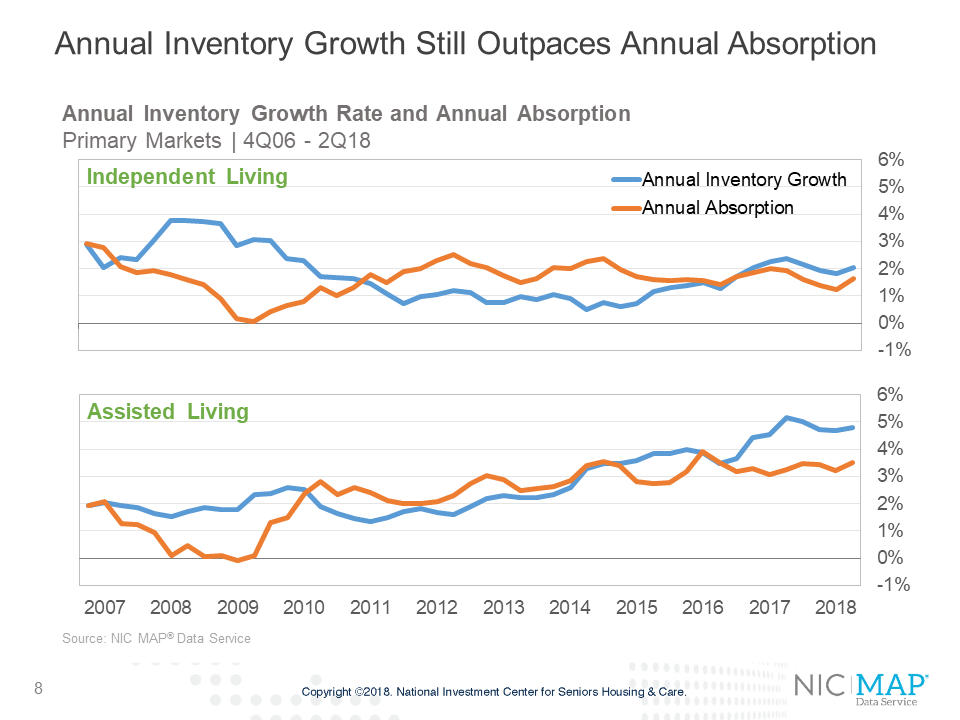
Takeaway #2: Annual inventory growth outpaced annual absorption for both assisted living and independent living
- Assisted living inventory growth has been ramping up for a longer period than independent living in the Primary Markets. In mid-2012, the occupancy rate of independent living was the same as for assisted living at 88.8%. Since that time, there has been a clear divergence in occupancy performance reflecting the differences in supply growth and demand for the two property types.
- As of the second quarter, annual inventory growth for assisted living was 4.8%, up from 4.7% in the first quarter, but below the record high 5.2% pace seen in the middle of 2017. Annual absorption accelerated to 3.5% from 3.2% and was the strongest since the second quarter of 2016.
- For majority independent living properties, annual inventory growth was 2.1%, above the growth in absorption of 1.7%. In contrast, annual absorption outpaced annual inventory growth from the first quarter of 2011 through the second quarter of 2016.
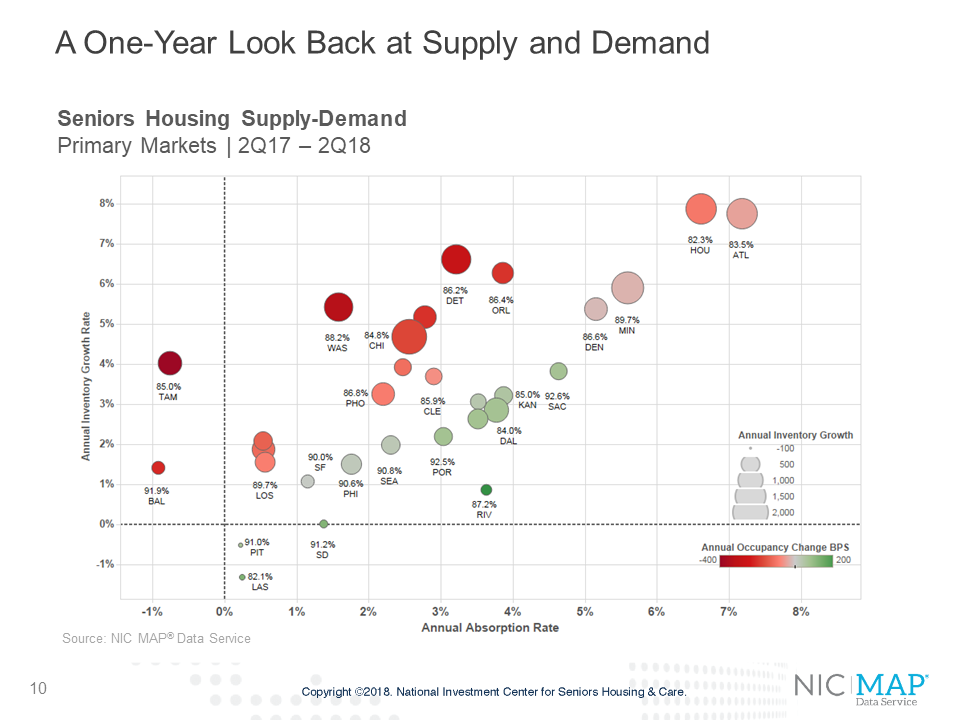
Key Takeaway #3: Six Markets Account for Nearly Half the Inventory growth in Past Year
- The most absolute unit growth in seniors housing in the past year occurred in Chicago, followed by Minneapolis, Atlanta, Houston, Detroit, and Washington D.C. These six markets each had more than 1,000 units of new inventory brought on line in the past year, with Chicago leading the pack with nearly 1,900 units. These six markets accounted for 46% of all new inventory in the Primary Markets in the past year.
- In terms of percentage growth in inventory, the largest gains took place in Houston, Atlanta, Detroit, Orlando and Minneapolis. The strongest net absorption also occurred in many of these markets as seen by the markets. This includes Atlanta, Houston, Minneapolis and Denver.
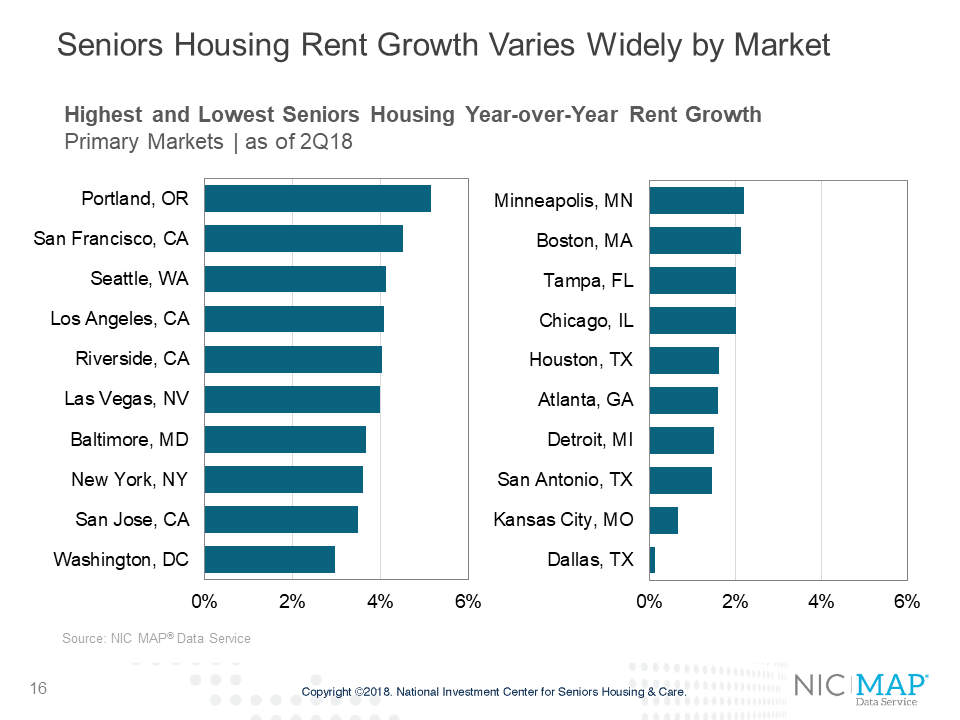
Key Takeaway #4: Same-store rent growth decelerated
- Same-store year-over-year asking rent growth for assisted living was 2.8% for the second quarter, down 20 basis points from the first quarter. For independent living, rent growth accelerated to 2.6% from 1.9% in the first quarter.
- There is wide variation in rent growth, however. Among the Primary markets, the top ranked metropolitan areas for year-over-year rent growth in overall seniors housing were Portland Oregon, San Francisco, Seattle and Los Angeles. Poorest rent growth was in Dallas, Kansas City, San Antonio, Detroit and Atlanta. Many of these same markets have some of the lowest occupancy rates in the nation as shown in earlier slides (Dallas, San Antonio, Atlanta, Houston and Chicago).
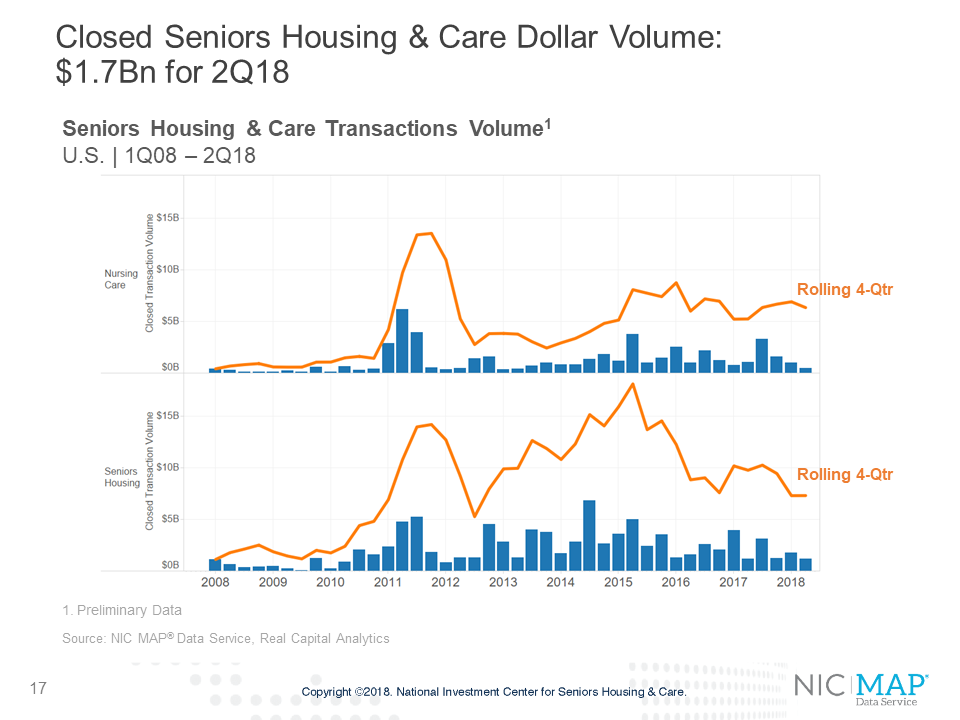
Key Takeaway #5: Closed Seniors Housing & Care Dollar Volume: $2.3bn for 1Q18
- Preliminary estimates of seniors housing and care transactions volume totaled $1.7 billion in the second quarter. That includes $1.2 billion for seniors housing and $500 million in nursing care transactions. The total volume was down 40% from the previous quarter’s $2.8 billion and down 25% from the second quarter of 2017 when volume came in at $2.2billion.
- Current figures show a 42% drop in single-property deals from 110 closed in the first quarter to 64 closed in the second quarter. Portfolio deals also decreased 42% from 19 closing in the first quarter of 2018 to only 11 in the second quarter.