Expanding on a recent NIC Blog Post that detailed care segment occupancy across the NIC MAP® 99 Primary and Secondary Markets within Continuing Care Retirement Communities (CCRCs, also referred to as life plan communities) compared with those in non-CCRC freestanding or combined communities, the second installment of this two-part blog post examines the regional occupancy performance of independent living, assisted living, memory care and nursing care segments within and across entrance fee and rental CCRCs.
The following narrative describes 3Q2018 CCRC occupancy aggregated from the NIC MAP Primary and Secondary Markets—99 of the nation’s largest core-based statistical areas (CBSAs), broken out across eight geographical regions. (Note that NIC MAP recently released data for 4Q2018). For the analysis, occupancy data for CCRCs, both entrance fee (EF) and rental payment CCRCs was considered. CCRC segments inventory was comprised of 63.3% entrance fee and 36.7% rental payment models in 3Q2018. The occupancy rate used was the “all occupancy” rate which includes properties still in lease-up as well as stabilized properties.
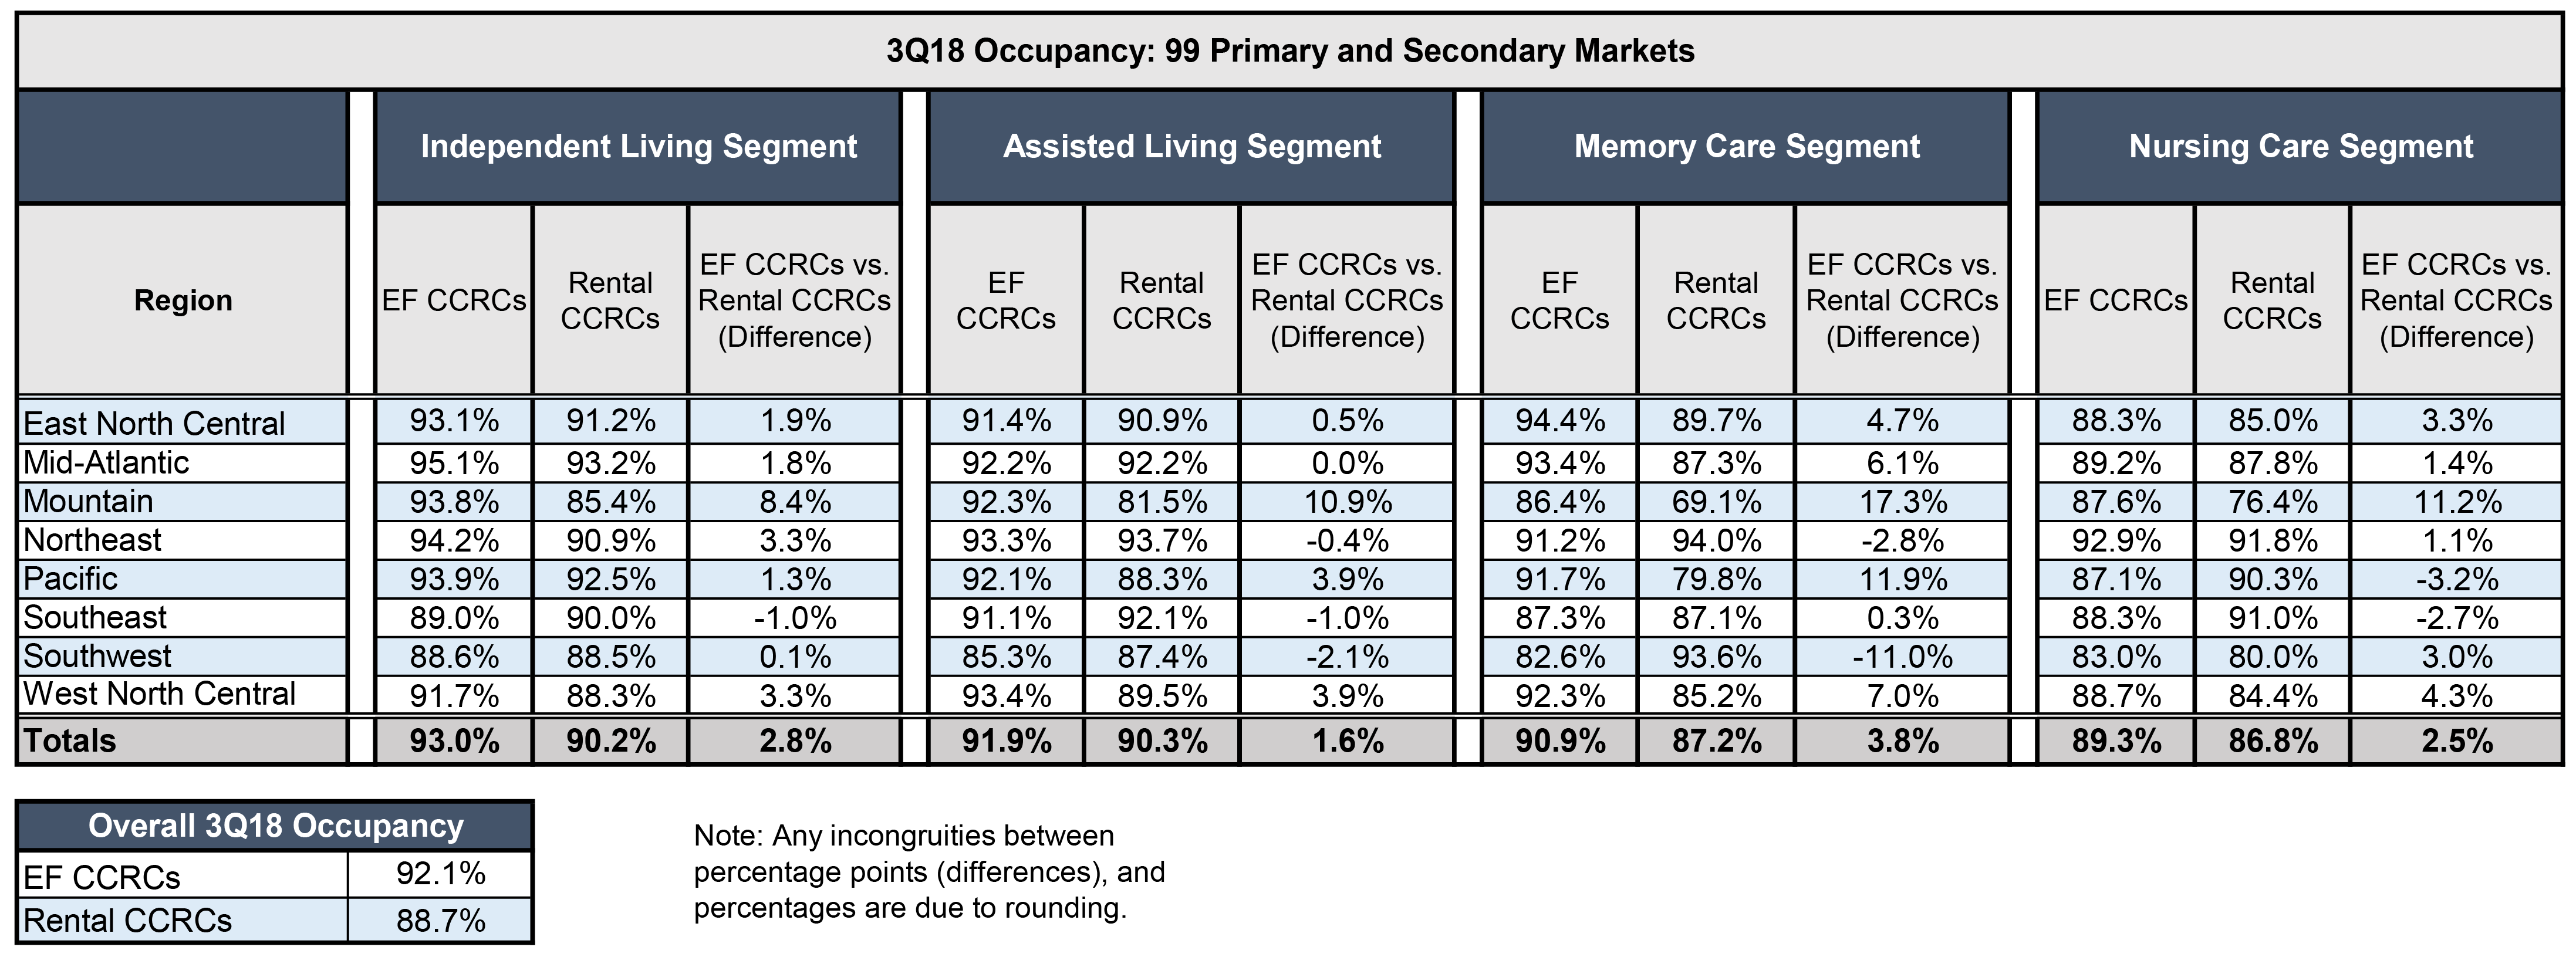
Entrance Fee CCRCs vs. Rental CCRCs
Entrance fee CCRCs generally had higher occupancy than rental CCRCs, with some variability by care segment and by geographic region. Entrance fee CCRC occupancy was 3.3 percentage points higher than rental CCRCs in the third quarter of 2018 (92.1% vs. 88.7%). Across regions, entrance fee CCRCs led rental CCRCs by 2.8 percentage points in the independent living segment (93.0% vs. 90.2%), 1.6 percentage points in the assisted living segment (91.9% vs. 90.3%), 3.8 points in the memory care segment (90.9% vs. 87.2%), and by 2.5 percentage points in the nursing care segment (89.3% vs. 86.8%). Note: the referenced percentage point differences were rounded.
- Independent living segment occupancy was the highest in the Mid-Atlantic region for both entrance fee CCRCs (95.1%) and rental CCRCs (93.2%). The largest differences in independent living segment occupancy between entrance fee and rental CCRCs was reported in the Mountain region (8.4 percentage points). Independent living segment occupancy was slightly higher in rental CCRCs than entrance fee CCRCs in the Southeast region (by a one percentage point difference).
- Assisted living segment occupancy was the highest in the Northeast for rental CCRCs (93.7%) and the West North Central and Northeast regions for entrance fee CCRCs (93.4% and 93.3%). Rental CCRCs had higher assisted living segment occupancy than entrance fee CCRCs in the Southwest, Southeast and Northeast regions. The largest differences in assisted living segment occupancy between entrance fee and rental CCRCs was reported in the Mountain region (10.9 percentage points).
- Memory care segment occupancy was highest in the East North Central and Mid-Atlantic for entrance fee CCRCs (94.4% and 93.4%) and the Northeast and Southwest for rental CCRCs (94.0% and 93.6%) but was particularly low for rental CCRCs in the Mountain region (69.1%). The largest differences in occupancy between entrance fee and rental CCRCs was reported in the Mountain region (17.3 percentage points) and Pacific region (11.9 percentage points), where entrance fee CCRC occupancy was higher than rental CCRCs, and in the Southwest, where rental CCRC occupancy was 11.0 percentage points higher than that for entrance fee CCRCs.
- Nursing care segment occupancy was highest in the Northeast for both entrance fee and rental CCRCs (92.9% and 91.8%). Occupancy was particularly low in the Mountain region for rental CCRCs (76.4%). Rental CCRCs had higher nursing care segment occupancy than entrance fee CCRCs in the Pacific and Southeast regions. The largest difference in nursing care segment occupancy between entrance fee and rental CCRCs was noted in the Mountain region (11.2 percentage points).
Higher occupancy in entrance fee CCRCs may be due in part to higher rates of resident turnover in rental-model CCRCs, according to data from ASHA’s State of Seniors Housing, 2018 database. While communities with rental CCRC payment plans offer monthly or annual leases for housing and services, entrance fee CCRCs include contract stipulations such as refund percentage and timing of refund, which may help retain residents who put down a sizable up-front fee to reside in a CCRC. An additional reason for higher occupancy rates in entrance fee CCRCs may be due in part to the fact that the majority of entrance fee CCRCs are nonprofit organizations (72.6%). According to NIC MAP, nonprofit CCRC occupancy in the Primary and Secondary Markets has consistently exceeded that of for-profit CCRCs by more than four percentage points since 2Q15.
However, product differences are unlikely to tell the whole story. Further analysis is needed to more fully explain CCRC segment occupancy performance by payment plan and by region. In addition to local economic drivers, income levels, inflation-adjusted purchasing power, and penetration rates, other contributing factors that could be explored include inventory growth patterns, consumer acceptance of the entrance fee model, and the health of the residential housing market—specifically as it relates to entrance fee CCRC occupancy performance since often CCRCs target upfront fees to local home sales prices near or around the median to enable consumers to fund a move with a near one-to-one exchange.
(Double-click the image below to enlarge.)