The following analysis examines broader occupancy trends, year-over-year changes in inventory, and same-store asking rent growth – by care segment – within 571 entrance fee Continuing Care Retirement Communities (CCRCs) and 488 rental CCRCs in the 99 NIC MAP Primary and Secondary Markets based on data through the first quarter of 2025.
Regional Entrance Fee and Rental CCRC Occupancy: 1Q 2025 vs. Time Series High
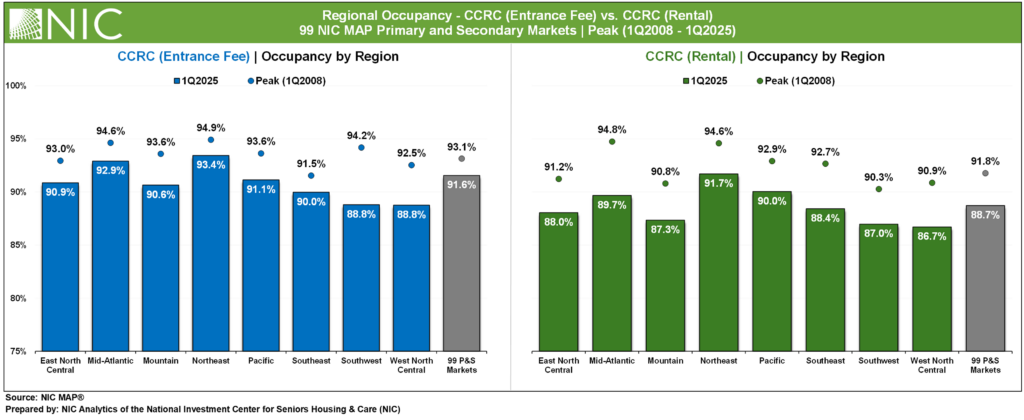
The exhibit below demonstrates regional occupancy rates for entrance fee and rental CCRCs across the 99 primary and secondary NIC MAP markets. Each bar represents occupancy as of the first quarter of 2025, while the markers above the bars indicate the highest occupancy recorded for each region since the first quarter of 2008. The difference between the current bar and its marker highlights the gap between present occupancy and each region’s historical peak.
In the first quarter of 2025, entrance fee CCRCs continued to outperform rental CCRCs in occupancy rates across all regions. The Northeast led with the highest occupancy at 93.4% and is the region closest to reaching its time series high of 94.9%, with an occupancy difference of just 1.5 percentage points (pps). Meanwhile, the Southwest (88.8%) lags furthest behind its time series peak of 94.2%, with a difference of 5.4pps.

For Rental CCRCs, the Northeast region recorded the highest rental occupancy at 91.7%, while the West North Central region reported the lowest at 86.7%. Compared to time series high occupancy, the Pacific region is closest, with a difference of 2.9pps, whereas the Mid-Atlantic shows the largest gap at 5.1pps.
Across the combined 99 NIC MAP primary and secondary markets, entrance fee CCRCs posted an average occupancy of 91.6% in the first quarter of 2025, compared to 88.7% for rental CCRCs. Entrance fee CCRCs trail the time series peak by 1.5pps and rental CCRCs by 3.1pps.
1Q 2025 Market Fundamentals by Care Segment – Entrance Fee CCRCs vs. Rental CCRCs
The exhibit below compares the market performance of entrance fee CCRCs and rental CCRCs by care segment for the first quarter of 2025, highlighting year-over-year changes in occupancy, inventory, and asking rent growth.
Occupancy. Entrance fee CCRCs continued to outpace rental CCRCs in occupancy rate across all care segments. The difference in the first quarter of 2025 occupancy rates between entrance fee CCRCs and rental CCRCs was largest in the independent living segment (2.6pps), followed by the nursing care segment (1.3pps), and the assisted living segment (0.4pps), with the smallest gap in the memory care segment (0.3pps).
The highest occupancy in entrance fee CCRCs (93.0%) and rental CCRCs (90.4%) was seen in the independent living care segment.

Asking Rent. The monthly average asking rent for entrance fee CCRCs across all care segments remained higher than rental CCRCs. Rental CCRCs showed higher year-over-year rent growth in memory care (3.6% to $8,021), and nursing care (4.6% to $403*) segments. Entrance fee CCRCs showed higher year-over-year rent growth in independent living (4.0% to $4,253)
Note, these figures are for asking rates and do not consider any discounts that may occur.
Inventory. Compared to year-earlier levels, assisted living inventory experienced the largest decline in rental CCRCs (2.8%) and the largest growth in entrance fee CCRCs (1.4%).
Negative inventory growth can occur when units/beds are temporarily or permanently taken offline or converted to another care segment, outweighing added inventory.
