April 11, 2024
NIC SHARK Series: Promising Outlook for Senior Housing with a Call to Action
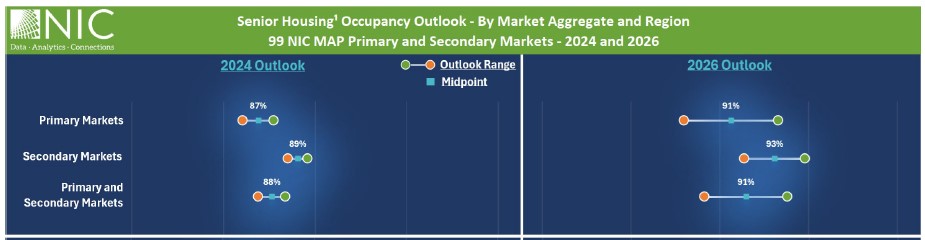
NIC Analytics launches the NIC SHARK series reports that dig deep into current data to help you plan for future demand. Senior housing is on the cusp of a notable upswing, with occupancy increases expected to continue and placing senior housing stock near maximum capacity in some cases by 2026. Anticipated demographics and demand expansion will drive growth, yet challenges may arise in meeting this surge because of aging inventory, potential supply shortfalls, and lengthy construction timelines. Will senior housing stakeholders capitalize on these trends and proactively prepare for the future, or will they maintain a passive wait-and-see stance? NIC Analytics anticipates that the sustained positive momentum in market performance metrics is likely to spark a “fear of missing out” (FOMO) among investors. See what the data shows and access the first NIC SHARK report here.
Medicare’s Changing Priorities Open Opportunities for the Industry

“We all have to partner together to provide better care, improve population health and spend the healthcare dollar in a more effective way,” said Dr. Meena Seshamani, MD, PhD, Deputy Administrator and Director of the Center for Medicare during a session at the 2024 NIC Spring Conference. “I want to drive everyone to a call to action.” During a lively Q&A format, the well-attended, keynote session addressed the direction of the Medicare program and what it means for senior housing and care. Read more here.
How to Succeed in the Growing Active Adult Rental Market
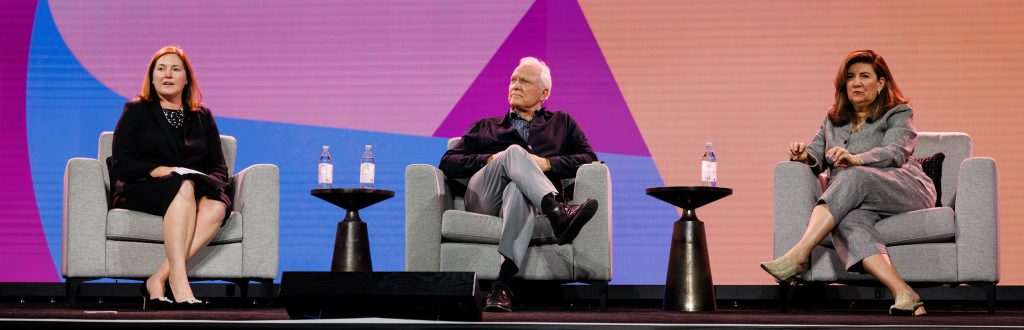
Robert May, Managing Director of Avenida Partners, and Jane Arthur Roslovic, CEO and Co-Founder of Treplus Communities, each took the stage in a highly interactive session at the 2024 NIC Spring Conference. Learn how Treplus Communities and Avenida Partners focus on the active adult consumer to create communities that are conducive to downsizing and distinct from traditional multifamily, while implementing and maintaining a strong sense of hospitality and brand. See highlights from the session including an audience poll on entering and expanding into the active adult rental space, including drivers and barriers to doing so, in this session recap.
Unlocking Success: Navigating the Operator-Owner Relationship
 In the dynamic world of senior living, the partnership between operators and owners holds the key to transforming ordinary buildings into vibrant, thriving communities. Success in senior living lies not merely in the individual efforts of operators or owners but in the seamless alignment of visions, strategies, and growth goals between these crucial stakeholders. Read more about best practices and keys to a successful operator-owner relationship here.
Justin Hutchens, NIC Data & Analytics Conference Program Chair
 On May 21st-22nd, NIC will host its second-annual Data & Analytics Conference. This year’s Conference Chair, Justin Hutchens, EVP Senior Housing and Chief Investment Officer, Ventas, shares his thoughts on the upcoming gathering and what attendees can expect at this year’s event here.