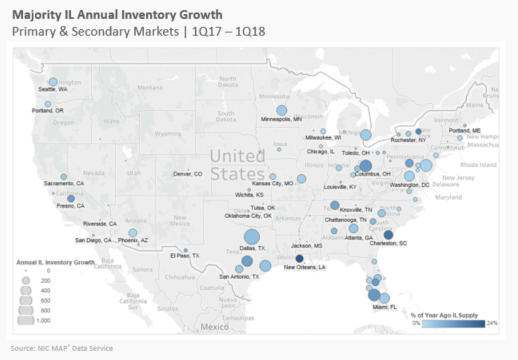
Supply and demand more balanced; occupancy sustained above 90%
In the first quarter of 2018, among the 31 primary markets tracked by NIC MAP, independent living had an occupancy rate of 90.3%, which was about 70 basis points less than stabilized occupancy. Comparatively, assisted living had a differential of 230 basis points, more than three times as large since there…
Read Post ›
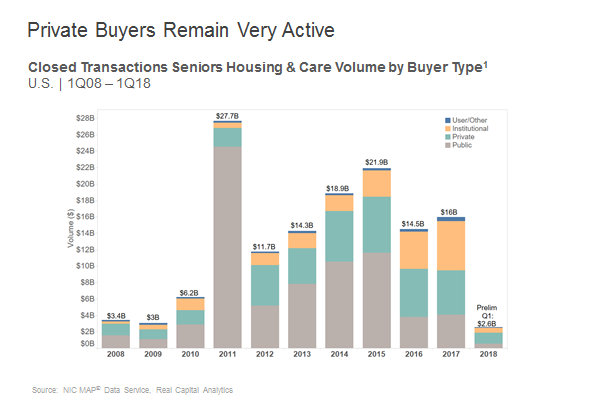
Seniors housing and care updated transactions figures show a total of $2.6 billion closed deals in the first quarter of 2018. That includes $1.7 billion of seniors housing, and $900 million in nursing care transactions. The total volume was down 5% from the previous quarter’s $2.7 billion, and down 45% from the first quarter of 2017 when volume totaled $4.7…
Read Post ›
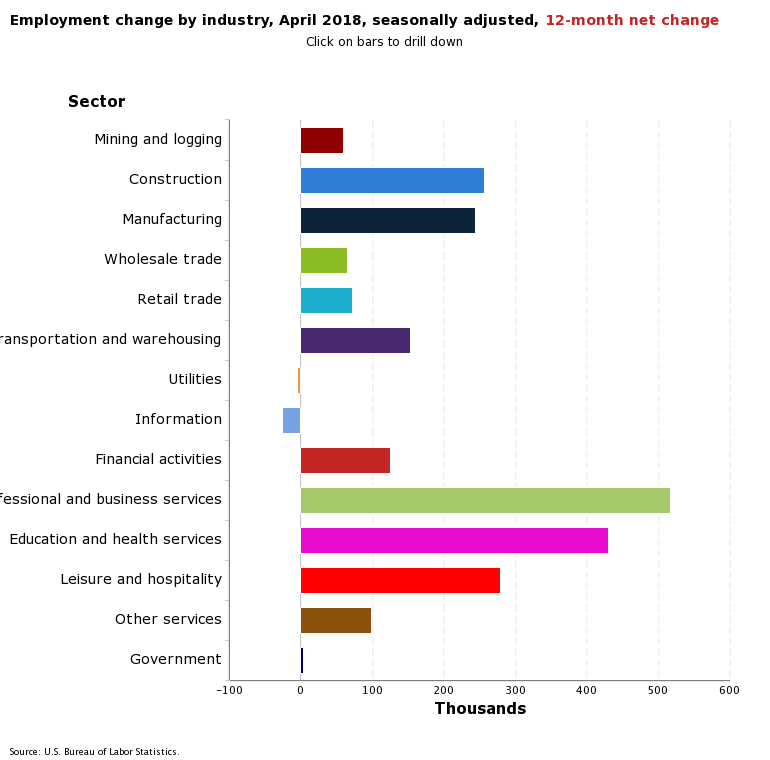
The Labor Department reported that there were 164,000 jobs created in the U.S. economy in April, below the consensus expectation of 193,000. This followed a downwardly revised gain of 324,000 jobs in February (originally reported as 326,000) and an upwardly revised gain of 135,000 in March (originally reported as 103,000). The two-month revision was a positive 30,000 new jobs.
The…
Read Post ›
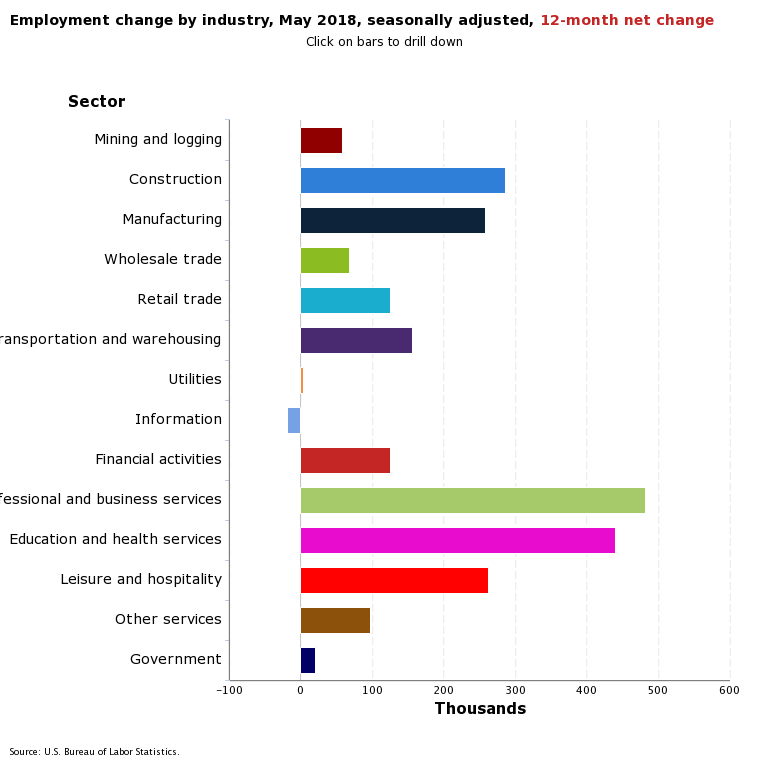
The Labor Department reported that there were 223,000 jobs created in the U.S. economy in May, well above the consensus expectation of 190,000. This followed a downwardly revised gain of 159,000 jobs in April (originally reported as 164,000) and an upwardly revised gain of 155,000 in March (originally reported as 135,000). The two-month revision was a positive 15,000 new jobs. …
Read Post ›
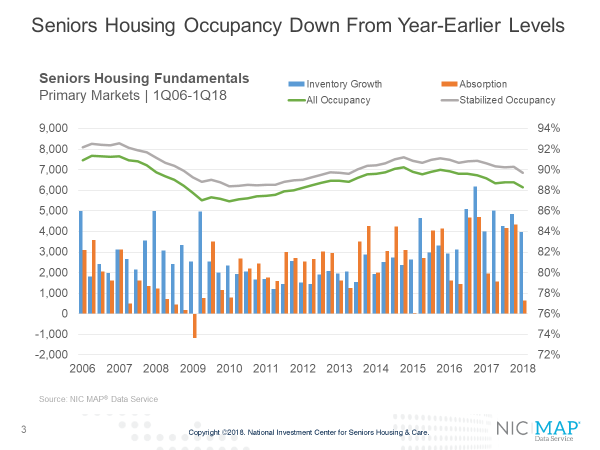
NIC MAP® Data Service clients attended a webinar in mid-April on the key seniors housing data trends during the first quarter of 2018. Key takeaways included the following.
Takeaway #1: Seniors housing occupancy fell to 88.3%
The all occupancy rate for seniors housing, which includes properties still in lease up was 88.3% in the first quarter, down 90 basis points…
Read Post ›