Lease-Up Trends by Segment Type
Benchmark data can inform project projections
By Lana Peck, Anne Standish and Beth Mace
Among the many factors that determine the profitability of a project is the pace of initial move-ins or leasing momentum. A well-located and rapidly leased-up project can build forward momentum for steady demand, high occupancy and solid revenue growth, and build a strong reputation in the trade area among potential residents and their adult child influencers. This Blog explores the topic of leasing and provides occupancy rate benchmarks by segment type on the median time it takes to lease units at newly opened properties based on a 12-year plus time series of leasing patterns collected by the NIC MAP Data Service.
Broadly, data on range of lease-ups and national trend data for seniors housing and care properties can be used in setting proforma occupancy in new development, studies to support financing, and benchmarking occupancy for non-stabilized communities as they fill up. This can help determine, for example, whether a marketing budget will be sufficient during the fill period or how new assisted living units with 45% occupancy four-quarters post-opening stacks up against others.
Some of the factors that affect lease-up rates include: depth of target market demographics, supply penetration, age and size of the property, quality of and proximity to competition, condition of the residential real estate market, consumer familiarity and acceptance, levels of presales before opening, and operator quality.
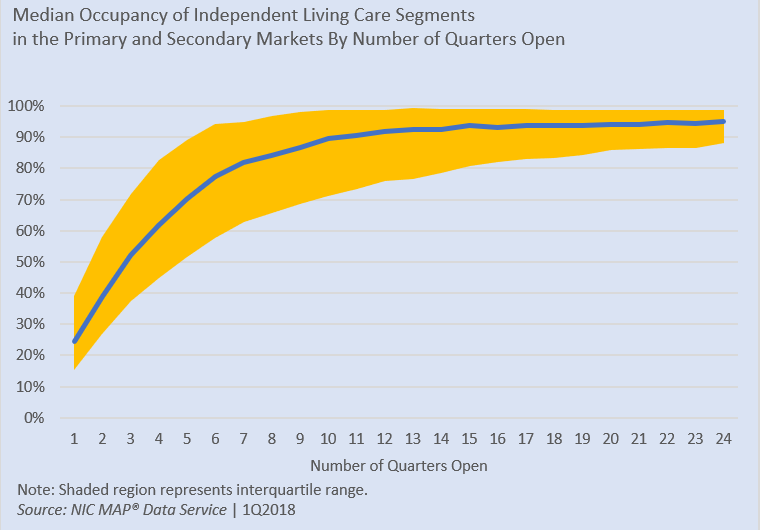
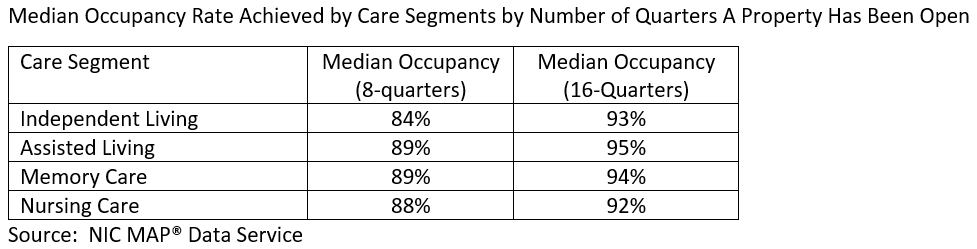
The table below provides the median occupancy rate achieved by newly opened distinct care segments by the number of quarters the property has been open. The data blends together properties in the NIC MAP 31 primary metropolitan markets since 4Q2005 and properties in the secondary markets since 1Q2008. To help assess upside and downside probabilities, the exhibits outline the realized range for the 25th and 75th percentiles as well.
As the table shows, eight quarters after opening, assisted living units and memory care units had the highest median occupancy rates of 89%, while independent living was lowest at 84%. After 16 quarters, the median occupancy for assisted living was 95%. Nursing care was lowest at 92%. It is worth noting that median occupancy rates are typically higher than the more frequently cited average occupancy rates.
More detail can also be ascertained from the NIC MAP Data Service data by segment type. For example, for newly opened independent living care segments during this period, the median reached 84% occupancy eight quarters following the property opening. At the same time, the lowest-performing quartile of these segments had less than 66% occupancy and the highest quartile had above 97% occupancy. By the end of 16 quarters after opening, median occupancy was 93%. The lowest quartile had 82% occupancy or less, and the highest quartile had reached 99% occupancy or more. (Note: The lowest quartile is not always made up of the same units, as low-performers improve and previously strong performers slip.) The median size of an independent living segment at a property opened during this period was 100 units.