Initial Move-in Rates for Independent Living Fall Below Year-Earlier Levels in Q4 2017
The NIC Map Data Service recently released national benchmark data through year-end 2017 for actual rates and leasing velocity. Key takeaways include:
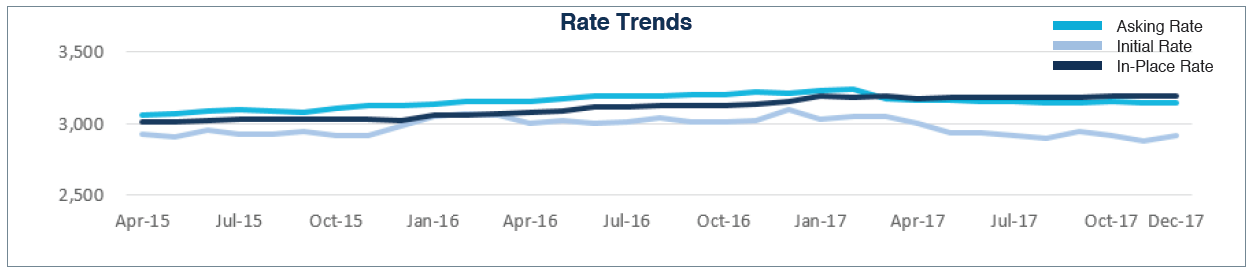
- Average initial move-in rates were below average asking rates for both independent living and assisted living properties, with monthly spreads larger for assisted living properties throughout the entire reported period.
- As of December 2017, assisted living initial rates averaged 8.3% below the average asking rate, which equates on an annualized basis to an average initial rate discount equivalent to 1.0 months, down from 1.2 months in December 2016. The discount for independent living was smaller at the equivalent of 0.9 month rent but was up from 0.4 months in December 2016.
- Average in-place rate growth for assisted living has been decelerating in recent months, with the average in-place rate in December 2017 registering only 0.9% higher than year-earlier average rate. In 2016, this figure was 3.4%. Similarly, in-place rate growth has decelerated for independent living, with year-over-year rate growth of 1.5% in December 2017, down from 4.3% in 2016.
- In contrast, growth rates for average assisted living initial move-in rates accelerated to 2.8% in December 2017 from the year-earlier level, the strongest annual pace since February 2017 and above the in-place rate growth of 0.9%. In contrast, move-in initial rates for independent living were 6.1% below year-earlier levels.
- The rate of move-ins exceeded or equaled the pace of move-outs in the last eight months of 2017 for assisted living, while the rate of move-outs exceeded move-ins during the early months of 2017. There was no clear monthly pattern for independent living during 2017. The decline in occupancy rates from December 2016 reflects a rate of move-outs that exceeded the pace of move-ins for both assisted living and independent living properties on an annual basis.
The NIC MAP Seniors Housing Actual Rates Report provides national data from approximately 250,000 units within more than 2,500 properties across the U.S. operated by 25 to 30 seniors housing providers. This monthly time series is comprised on end-of-month data for each respective month.