A Tale of Many Cities

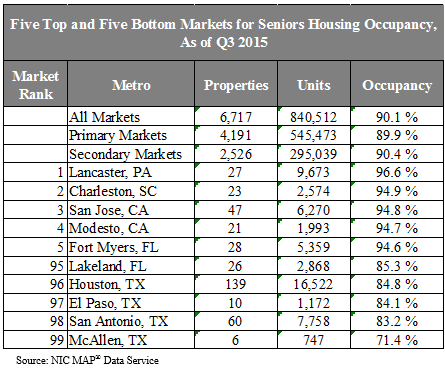
Occupancy Winners and Losers. Seniors housing occupancy rates vary considerably across the nation, with Lancaster, PA, ranking as the strongest occupied market among the NIC 99 in the third quarter at 96.9%, followed by Charleston, SC (at 94.9%), and San Jose, CA (at 94.8%). Four metro areas with the lowest occupancy rates share one thing in common—Texas. These include McAllen, San Antonio, El Paso, and Houston, and all had occupancy rates at or below 85% in the third quarter. The NIC 99 metro average was 90.1% by comparison.
Houston has suffered from quick supply delivery with a 15% increase in inventory since early 2013 (compared with 5% for the NIC 99 markets), while San Antonio has suffered from generally weak demand and only moderate supply pressures. El Paso has been suffering from weak demand for a long while, and McAllen is a small and somewhat volatile market.
Lancaster, PA, is an interesting market with the highest occupancy and penetration rates in the nation (37.2%). Seniors housing is a long-established property type and lifestyle choice in this market. Occupancy rates have remained above 92% since NIC began collecting data in 2008. Charleston, SC, has experienced rising occupancy rates since early 2012, but this, too, is a rather small market.
The stand out is San Jose, which has had an occupancy rate of 94% or more since mid-2014 as fluctuations in demand and supply have largely offset each other. San Jose also ranks as the fastest growing job market in the nation; as of September (most recent data available), it posted a 4.7% gain in jobs from year-earlier levels (compared with 2% for the nation). The metro area’s high concentration of technology jobs have served it well since the recession ended.
The reverse can be said for Houston, where the drop in energy prices has taken a toll on job growth. In September, Houston’s economy expanded at a slower rate than the nation, a sharp contrast from the 2010-to-2014 period, when growth in the metro area dwarfed that of the nation. Going forward and for the near future, this slowdown is likely to influence the ability of the market to absorb new product being delivered.

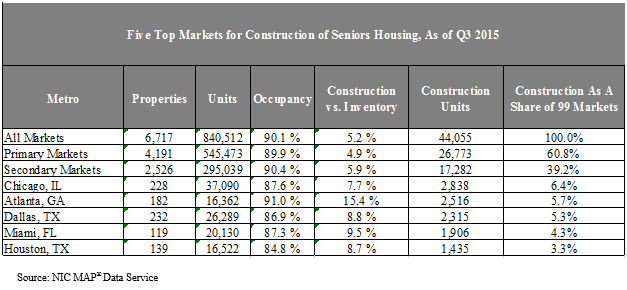
Construction: Not All Markets Are Equal. There is a lot of discussion these days on new supply. Since late 2012, there has been a 5% increase in inventory for the NIC 99 markets. It’s notable that the occupancy rate for the NIC 99 markets increased from 89.4% to 90.0% over this same period, meaning that demand has largely been able to keep up with new development. Looking ahead, there are 44,000 units currently under construction for these same NIC 99 markets, a projected additional 5% gain in inventory over the next two years. The question is if demand will have the same ability to keep pace with new development. And in making this assessment, it is important to know that construction is not occurring at the same pace in all markets and as discussed above, some markets have particularly high occupancy rates, while others do not.
Indeed by market, there are 23 metro areas of the NIC 99 that have 1% or less of their inventory under construction. On the other hand, 24 metro areas account for 2/3 of all current construction for the 99 markets. Five of these markets account for 25% of the construction. These include Chicago (6.4% of the 99 market construction is occurring here or 2,838 units), Atlanta (5.7%, 2,516 units), Dallas (5.3%, 2,315 units), Miami (4.3%, 1,906 units) and Houston (3.3%, 1,415 units).


